アップデート済
COVID-19: Daily change per capita (EU only)
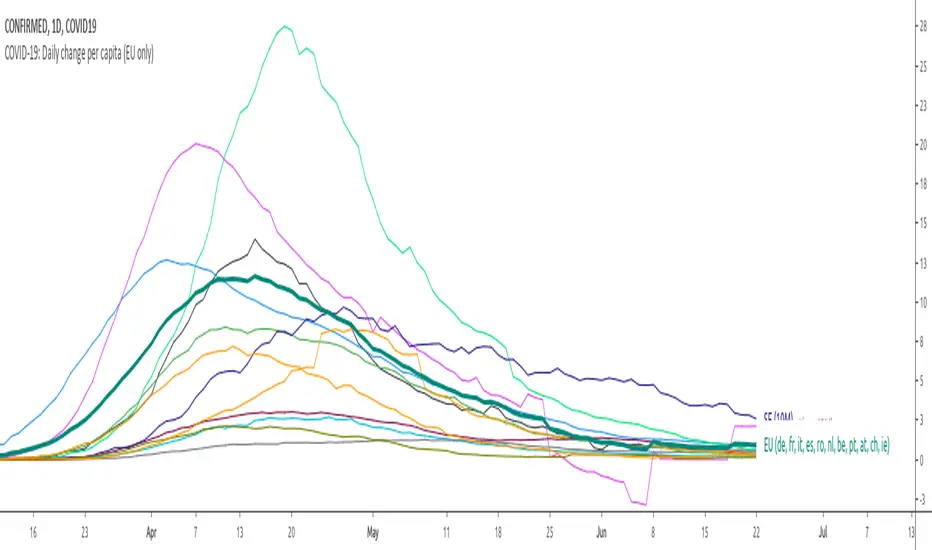
New confirmed cases per day (daily change) is one thing, just an absolute value but when we put this number in context of population (per million people) of each country the situation is a bit different.
We can easily see that, at the moment (Apr 2nd, 2020), the most affected country is Spain (~150 new cases per million people per day) and surprisingly the second one is Switzerland (CH). We can also see Spain or Belgium's steep curve relative to other countries.
I know that some countries run more tests than the others and the outcome might not be reflect the reality but this is the official data that is available.
We can easily see that, at the moment (Apr 2nd, 2020), the most affected country is Spain (~150 new cases per million people per day) and surprisingly the second one is Switzerland (CH). We can also see Spain or Belgium's steep curve relative to other countries.
I know that some countries run more tests than the others and the outcome might not be reflect the reality but this is the official data that is available.
リリースノート
# Changelog## 0.0.2 - 20200405
### Added
- Portugal - with more than 10k total cases
- add deaths graphs - toggle between confirmed / deaths graphs in Settings
### Changed
- per capita calculation
- dynamic/relative positioning for legend
- population info for each country
リリースノート
Add Sweden (SE) with more than 10k cases and 1k deaths.リリースノート
Adding Ireland - IE with more than 1k deaths, fix EU per capita calculationリリースノート
Remove COVID19 prefix
免責事項
これらの情報および投稿は、TradingViewが提供または承認する金融、投資、取引、またはその他の種類の助言もしくは推奨であることを意図したものではなく、またこれらに該当するものでもありません。詳細は利用規約をご覧ください。
免責事項
これらの情報および投稿は、TradingViewが提供または承認する金融、投資、取引、またはその他の種類の助言もしくは推奨であることを意図したものではなく、またこれらに該当するものでもありません。詳細は利用規約をご覧ください。