OPEN-SOURCE SCRIPT
QuantumPips ReactionTrack
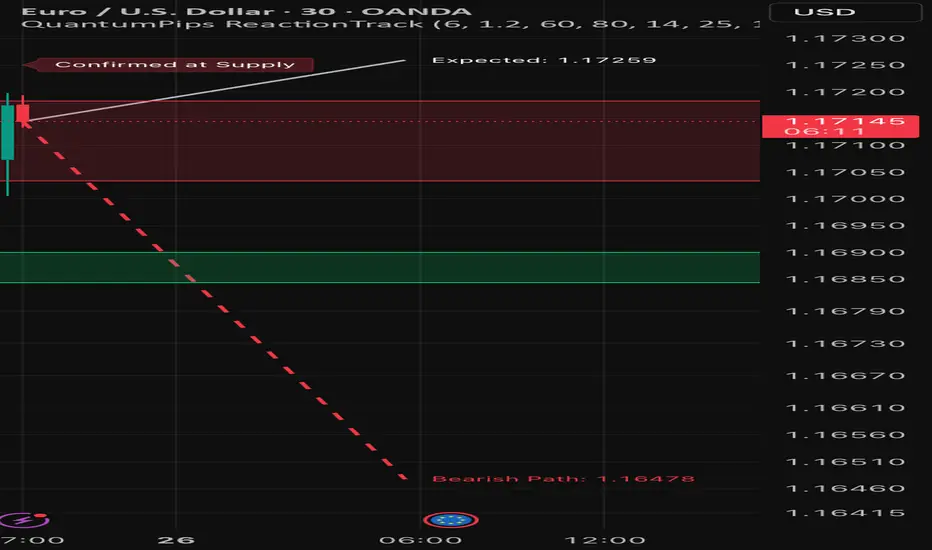
QuantumPips ReactionTrack is an indicator that marks the most recent Supply and Demand zones created by strong impulse candles, then waits for a confirmed reaction from those zones before drawing a forward projection path (expected move guide).
What it does (simple overview)
ReactionTrack follows a clean sequence:
It keeps your chart clean by showing only the most recent Supply and Demand zones.
1) Recent Zones (Supply & Demand)
ReactionTrack identifies impulse candles using:
When an impulse candle appears, the indicator builds a “recent zone” from the most recent opposite candle within the search window:
Bearish impulse → Recent Supply
Bullish impulse → Recent Demand
Zone Extension controls how far the zones extend forward on the chart.
Optional zone labels can be shown/hidden.
✅ Only the latest supply zone and latest demand zone are kept (older ones are replaced).
2) Reaction Confirmation (the “go” signal)
ReactionTrack confirms a reaction only when price is inside a zone and shows directional intent:
Basic confirmation
Optional: Close-break confirmation (stricter)
If enabled (Require Close Break For Confirmation), it also requires:
This helps filter weaker reactions and reduces noise.
3) Forward Projection Path (drawn only after confirmation)
Once a reaction is confirmed, the indicator holds an active context:
Only then it draws a forward path for Projection Length bars:
The projection is based on recent volatility (ATR/true range behavior) plus a drift component (trend slope vs ATR). It is meant as an expected-move guide, not a prediction.
On-chart labels (what you’ll see)
Optional confirmation labels:
How to use (simple workflow)
* This is an indicator for charting and analysis only. It does not execute trades and does not guarantee outcomes. Always use risk management. *
What it does (simple overview)
ReactionTrack follows a clean sequence:
- Detect impulse → build zones
- Wait for price to return to a zone
- Confirm the reaction
- Project a forward path only after confirmation
It keeps your chart clean by showing only the most recent Supply and Demand zones.
1) Recent Zones (Supply & Demand)
ReactionTrack identifies impulse candles using:
- Impulse Threshold (ATR x): candle range must be ≥ ATR × threshold
- Impulse Min Body %: candle body must be strong (filters wick-heavy candles)
When an impulse candle appears, the indicator builds a “recent zone” from the most recent opposite candle within the search window:
Bearish impulse → Recent Supply
- Finds the most recent bullish candle in the lookback
- Builds a supply zone from that candle’s structure
Bullish impulse → Recent Demand
- Finds the most recent bearish candle in the lookback
- Builds a demand zone from that candle’s structure
Zone Extension controls how far the zones extend forward on the chart.
Optional zone labels can be shown/hidden.
✅ Only the latest supply zone and latest demand zone are kept (older ones are replaced).
2) Reaction Confirmation (the “go” signal)
ReactionTrack confirms a reaction only when price is inside a zone and shows directional intent:
Basic confirmation
- Demand reaction: bullish candle (close > open) while price overlaps demand
- Supply reaction: bearish candle (close < open) while price overlaps supply
Optional: Close-break confirmation (stricter)
If enabled (Require Close Break For Confirmation), it also requires:
- Bullish confirmation: close > high[1]
- Bearish confirmation: close < low[1]
This helps filter weaker reactions and reduces noise.
3) Forward Projection Path (drawn only after confirmation)
Once a reaction is confirmed, the indicator holds an active context:
- Confirmed at Demand → bullish context
- Confirmed at Supply → bearish context
Only then it draws a forward path for Projection Length bars:
- Bullish: dashed path toward a projected upper level
- Bearish: dashed path toward a projected lower level
- Optional Mid projection line
- Optional Projection labels (target values)
The projection is based on recent volatility (ATR/true range behavior) plus a drift component (trend slope vs ATR). It is meant as an expected-move guide, not a prediction.
On-chart labels (what you’ll see)
- Recent Supply / Recent Demand (optional)
- Waiting for Confirmation (state label)
- Confirmed at Demand / Confirmed at Supply (state label)
Optional confirmation labels:
- Bullish Reaction Confirmed
- Bearish Reaction Confirmed
How to use (simple workflow)
- Let ReactionTrack print the newest Supply/Demand zones.
- Wait for price to return into one zone.
- Look for a confirmed reaction (stronger when Close Break is ON).
- Use the projected path as a planning guide (direction + potential target area), then apply your own entry/stop/TP rules.
* This is an indicator for charting and analysis only. It does not execute trades and does not guarantee outcomes. Always use risk management. *
オープンソーススクリプト
TradingViewの精神に則り、このスクリプトの作者はコードをオープンソースとして公開してくれました。トレーダーが内容を確認・検証できるようにという配慮です。作者に拍手を送りましょう!無料で利用できますが、コードの再公開はハウスルールに従う必要があります。

QuantumPips — Trade Structure. Not Noise.
Market Structure Pro (Invite-only): quantumpips.io/msp
Educational only. Not financial advice.
Market Structure Pro (Invite-only): quantumpips.io/msp
Educational only. Not financial advice.
免責事項
これらの情報および投稿は、TradingViewが提供または承認する金融、投資、取引、またはその他の種類の助言もしくは推奨であることを意図したものではなく、またこれらに該当するものでもありません。詳細は利用規約をご覧ください。
オープンソーススクリプト
TradingViewの精神に則り、このスクリプトの作者はコードをオープンソースとして公開してくれました。トレーダーが内容を確認・検証できるようにという配慮です。作者に拍手を送りましょう!無料で利用できますが、コードの再公開はハウスルールに従う必要があります。
QuantumPips — Trade Structure. Not Noise.
Market Structure Pro (Invite-only): quantumpips.io/msp
Educational only. Not financial advice.
Market Structure Pro (Invite-only): quantumpips.io/msp
Educational only. Not financial advice.
免責事項
これらの情報および投稿は、TradingViewが提供または承認する金融、投資、取引、またはその他の種類の助言もしくは推奨であることを意図したものではなく、またこれらに該当するものでもありません。詳細は利用規約をご覧ください。