アップデート済
Alpha Trend Hunter | PropTraderz
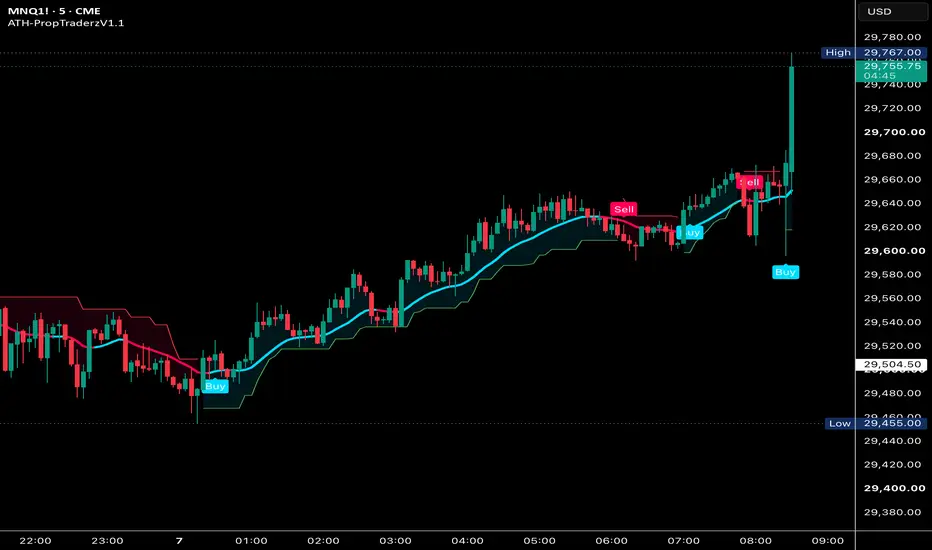
Overview
Alpha Trend Hunter is an overlay trend-analysis indicator designed to identify directional transitions by requiring agreement between two independent components:
a custom smoothed synthetic price structure derived from OHLC data;
an ATR-based SuperTrend filter.
The indicator does not generate a Buy or Sell label from either component independently.
A signal is created only when both modules agree on direction and the combined directional state changes.
The intended workflow is therefore:
Price Smoothing → Synthetic Trend Direction → Volatility Trend Confirmation → Directional Signal
The underlying concepts of exponential moving averages, synthetic Heikin-Ashi-style calculations, ATR and SuperTrend are established technical-analysis concepts. The implementation focuses on combining them into a two-stage confirmation framework intended to reduce isolated directional transitions that are not supported by both price structure and volatility-adjusted trend.
1. Smoothed OHLC Foundation
The first stage of the indicator applies an exponential moving average independently to:
Open
High
Low
Close
The default smoothing period is:
14 bars
This creates four smoothed OHLC series:
smoothed open;
smoothed high;
smoothed low;
smoothed close.
The purpose of this initial stage is to reduce some of the short-term noise present in raw candles before the synthetic trend structure is calculated.
A larger HA Period produces more smoothing and slower reactions.
A smaller HA Period keeps the synthetic structure closer to raw price and therefore makes it more responsive.
2. Custom Synthetic Heikin-Ashi-Style Structure
After the OHLC series are smoothed, the script calculates a synthetic typical value:
Synthetic Typical =
(Smoothed Open + Smoothed High + Smoothed Low + Smoothed Close) / 4
A recursive synthetic open is then calculated.
On initialization:
Synthetic Open =
(Smoothed Open + Smoothed Close) / 2
After initialization:
Synthetic Open =
(Previous Synthetic Open + Previous Synthetic Typical) / 2
This recursive calculation creates a smoother directional structure that carries information forward from previous bars.
It should be understood as a custom Heikin-Ashi-style synthetic calculation, rather than the standard Heikin Ashi candle series supplied directly by TradingView.
3. Synthetic High and Low
The script constructs synthetic upper and lower values using the smoothed high/low together with the synthetic open and synthetic typical value.
Synthetic High
The maximum of:
smoothed high;
synthetic open;
synthetic typical.
Synthetic Low
The minimum of:
smoothed low;
synthetic open;
synthetic typical.
These values define the working synthetic price range used by the trend-line calculation.
4. Synthetic Mid-Line
The midpoint of the synthetic range is calculated as:
Mid-Line = Synthetic Low +
(Synthetic High − Synthetic Low) / 2
This is equivalent to the midpoint between the custom synthetic high and low.
The mid-line is then smoothed again using an EMA.
The default secondary smoothing length is:
2 bars
The result is plotted as the primary visible trend line.
5. Trend-Line Direction
The color of the main trend line is determined by the relationship between:
synthetic open;
synthetic typical price.
Bullish synthetic structure
When:
Synthetic Open < Synthetic Typical
the structure is interpreted as bullish.
Bearish synthetic structure
When:
Synthetic Open > Synthetic Typical
the structure is interpreted as bearish.
The trend line therefore provides a continuous visual representation of the direction calculated from the custom synthetic price series.
6. Secondary Smoothing
The Smooth parameter controls the final EMA applied to the synthetic midpoint.
Default:
2
Lower value
Produces:
faster trend-line response;
closer tracking of short-term movement;
potentially more directional changes.
Higher value
Produces:
smoother trend line;
slower reaction;
stronger filtering of small changes.
This parameter affects the displayed synthetic trend line.
It is separate from the HA Period used to smooth the original OHLC values.
7. SuperTrend Confirmation Filter
The second major component is TradingView's ATR-based SuperTrend calculation.
The SuperTrend uses two user-configurable parameters:
ATR Period
Factor
Default values:
ATR Period = 2
Factor = 2.0
SuperTrend constructs volatility-adjusted trailing boundaries around price.
The active trend direction changes when price moves sufficiently through the corresponding volatility boundary.
8. SuperTrend Direction
The script interprets the SuperTrend direction as:
Bullish
stDir < 0
Bearish
stDir > 0
The active bullish or bearish SuperTrend line is plotted independently.
A lightly shaded area between candle midpoint and the active SuperTrend boundary provides additional visual context.
9. ATR Period
The ATR Period controls how quickly the volatility measurement reacts to changing market conditions.
The default value is relatively short:
2 periods
Smaller ATR Period
Generally creates:
faster volatility adaptation;
more responsiveness to recent price movement.
Larger ATR Period
Generally creates:
smoother ATR values;
slower adaptation;
less sensitivity to individual short-term volatility changes.
Because the default setting is intentionally responsive, users should test longer ATR periods when applying the indicator to noisier instruments or lower timeframes.
10. SuperTrend Factor
The Factor controls the distance of the SuperTrend boundary from price.
Conceptually:
SuperTrend distance ∝ ATR × Factor
Therefore:
Lower Factor
Generally produces:
tighter SuperTrend boundaries;
faster trend changes;
more frequent directional transitions;
increased sensitivity to noise.
Higher Factor
Generally produces:
wider boundaries;
slower trend changes;
fewer transitions;
stronger filtering of smaller price movements.
So, similar to the Sensitivity concept in the previous indicators:
Higher Factor = generally fewer/slower SuperTrend transitions.
Lower Factor = generally more/faster transitions.
11. Dual-Confirmation Signal Logic
Signals require directional agreement between the synthetic price structure and SuperTrend.
Bullish agreement
A bullish state exists when:
synthetic open is below synthetic typical;
AND SuperTrend is bullish.
In simplified form:
Synthetic Bullish + SuperTrend Bullish = Long State
Bearish agreement
A bearish state exists when:
synthetic open is above synthetic typical;
AND SuperTrend is bearish.
In simplified form:
Synthetic Bearish + SuperTrend Bearish = Short State
Neither condition alone produces a signal.
12. Buy Signals
A Buy label appears when the indicator transitions into a new bullish agreement state.
This requires:
bullish synthetic trend;
bullish SuperTrend;
the combined bullish condition was not active on the previous bar;
the previous stored signal state was not already bullish.
Once the bullish state is recorded, repeated Buy labels are suppressed until the indicator first transitions into the opposite directional state.
This prevents the indicator from printing a Buy label on every bullish candle.
13. Sell Signals
A Sell label follows the inverse logic.
It requires:
bearish synthetic trend;
bearish SuperTrend;
a new bearish agreement state;
the previous stored state not already being bearish.
The persistent signal-state variable therefore allows the indicator to mark directional transitions rather than continuous conditions.
14. Why Two Trend Components Are Used
The two components measure trend differently.
Component Main role
Smoothed OHLC Reduces raw candle noise
Synthetic structure Measures directional price relationship
Synthetic trend line Visualizes smoothed structural direction
ATR/SuperTrend Volatility-adjusted trend confirmation
State engine Prevents duplicate signals
Buy/Sell labels Marks changes in confirmed direction
The synthetic component is derived primarily from smoothed price structure.
SuperTrend is driven by price plus volatility.
Requiring agreement therefore attempts to avoid treating a change in either calculation alone as sufficient confirmation.
15. Example Bullish Interpretation
Suppose the synthetic trend changes bullish.
That condition alone does not immediately require a Buy label.
The indicator also evaluates SuperTrend.
If SuperTrend remains bearish, the two systems disagree and no bullish signal is generated.
When both eventually satisfy:
Synthetic Trend = Bullish
and
SuperTrend = Bullish
a new bullish combined state can generate a Buy signal.
This structure is intended to filter some early synthetic transitions that occur before volatility-adjusted trend confirmation.
16. Example Bearish Interpretation
The same process applies inversely.
A bearish synthetic trend is insufficient by itself.
The SuperTrend direction must also be bearish.
Once both components agree and the indicator transitions from its previous state, a Sell signal can be displayed.
17. Signal Frequency
Signal frequency depends primarily on three parameters.
HA Period
Controls initial OHLC smoothing.
Higher values generally produce slower synthetic directional changes.
Smooth
Controls final smoothing of the synthetic midpoint trend line.
Higher values produce a smoother displayed trend line.
SuperTrend Factor
Controls volatility-boundary distance.
Higher values generally require a larger price movement before SuperTrend changes direction.
Because these parameters affect different parts of the framework, they should not be interpreted as interchangeable sensitivity controls.
18. Suggested Starting Parameters
The default configuration is:
HA Period: 14
Smooth: 2
ATR Period: 2
Factor: 2.0
These values provide a relatively responsive configuration.
Users working with particularly noisy instruments or very short timeframes may wish to test:
longer HA Periods;
longer ATR Periods;
larger SuperTrend Factors.
Users wanting faster response can experiment with smaller values.
No parameter combination is universally optimal.
19. Trend Line vs Signal
The main synthetic trend line and the Buy/Sell signals should not be interpreted as the same feature.
The trend line continuously reflects the synthetic structure.
Signals require additional SuperTrend agreement.
Therefore, the trend line can change directional state before a Buy or Sell label appears.
This difference is intentional.
20. Alerts
The indicator provides two alert conditions:
Buy Signal
Sell Signal
The Buy alert corresponds to a new bullish combined state.
The Sell alert corresponds to a new bearish combined state.
Alerts indicate only that the programmed conditions have been met.
They do not constitute independent trade recommendations.
21. Real-Time Behavior
The indicator evaluates information from the currently developing candle.
Consequently, conditions can evolve while a live candle is still open.
For traders who require confirmed signals, the safest interpretation is to evaluate the signal after the corresponding chart candle has closed.
The indicator should therefore not be marketed as universally non-repainting without additional restrictions or testing.
Historical conditions are naturally evaluated using completed bars, while a live candle can still change before closure.
22. No Higher-Timeframe Data Dependency
The current version does not request external symbols or higher-timeframe series.
Its calculations are based on the OHLC and volatility information of the chart on which it is applied.
This makes the indicator simpler than a multi-timeframe framework, but its behavior will still differ substantially according to the selected chart timeframe.
23. Timeframe Considerations
On lower timeframes:
market noise is greater;
synthetic trend changes may occur more frequently;
short ATR periods are more reactive;
SuperTrend reversals can occur more often.
On higher timeframes:
signals generally develop more slowly;
each transition represents a larger amount of underlying price movement.
Parameter values should therefore be evaluated independently for each timeframe and market.
24. Limitations
Alpha Trend Hunter is a reactive trend indicator.
It does not predict future price.
The underlying calculations use:
historical price;
current price;
moving averages;
ATR;
recursive synthetic values.
These calculations inherently react after price information becomes available.
A stronger degree of smoothing generally decreases noise but also increases lag.
25. Sideways-Market Limitation
The indicator is fundamentally trend-oriented.
During sideways or rapidly alternating conditions, both synthetic trend calculations and SuperTrend can produce repeated directional transitions.
The dual-confirmation requirement can reduce some isolated changes, but it cannot eliminate whipsaw risk.
The indicator does not contain a dedicated ADX or market-regime filter in its current version.
26. Risk Management
The indicator does not calculate:
position size;
account risk;
stop-loss placement;
reward/risk targets;
portfolio exposure.
Users must determine risk independently.
A Buy or Sell label indicates only a transition in the indicator's defined directional state.
27. What Alpha Trend Hunter Does Not Do
Alpha Trend Hunter does not:
execute orders;
connect to a brokerage account;
manage positions;
guarantee profitable signals;
predict exact tops or bottoms;
guarantee trend continuation;
identify institutional activity;
determine appropriate leverage;
determine individualized risk.
It is a technical-analysis and trend-visualization tool.
28. Intended Use
A practical workflow is:
use the synthetic trend line to observe the underlying smoothed direction;
observe the SuperTrend volatility regime;
wait for agreement between both components;
use the Buy/Sell transition as confirmation that a new combined state has formed;
evaluate market structure and personal risk independently before making any trading decision.
The indicator is designed to answer:
“Are smoothed price structure and volatility-adjusted trend currently pointing in the same direction?”
rather than:
“Will the next trade be profitable?”
Educational Purpose
Alpha Trend Hunter is intended for technical analysis, research and educational use.
Users should independently consider:
price structure;
volatility;
liquidity;
economic events;
timeframe;
execution conditions;
risk management.
Historical signals do not guarantee future results.
Alpha Trend Hunter is an overlay trend-analysis indicator designed to identify directional transitions by requiring agreement between two independent components:
a custom smoothed synthetic price structure derived from OHLC data;
an ATR-based SuperTrend filter.
The indicator does not generate a Buy or Sell label from either component independently.
A signal is created only when both modules agree on direction and the combined directional state changes.
The intended workflow is therefore:
Price Smoothing → Synthetic Trend Direction → Volatility Trend Confirmation → Directional Signal
The underlying concepts of exponential moving averages, synthetic Heikin-Ashi-style calculations, ATR and SuperTrend are established technical-analysis concepts. The implementation focuses on combining them into a two-stage confirmation framework intended to reduce isolated directional transitions that are not supported by both price structure and volatility-adjusted trend.
1. Smoothed OHLC Foundation
The first stage of the indicator applies an exponential moving average independently to:
Open
High
Low
Close
The default smoothing period is:
14 bars
This creates four smoothed OHLC series:
smoothed open;
smoothed high;
smoothed low;
smoothed close.
The purpose of this initial stage is to reduce some of the short-term noise present in raw candles before the synthetic trend structure is calculated.
A larger HA Period produces more smoothing and slower reactions.
A smaller HA Period keeps the synthetic structure closer to raw price and therefore makes it more responsive.
2. Custom Synthetic Heikin-Ashi-Style Structure
After the OHLC series are smoothed, the script calculates a synthetic typical value:
Synthetic Typical =
(Smoothed Open + Smoothed High + Smoothed Low + Smoothed Close) / 4
A recursive synthetic open is then calculated.
On initialization:
Synthetic Open =
(Smoothed Open + Smoothed Close) / 2
After initialization:
Synthetic Open =
(Previous Synthetic Open + Previous Synthetic Typical) / 2
This recursive calculation creates a smoother directional structure that carries information forward from previous bars.
It should be understood as a custom Heikin-Ashi-style synthetic calculation, rather than the standard Heikin Ashi candle series supplied directly by TradingView.
3. Synthetic High and Low
The script constructs synthetic upper and lower values using the smoothed high/low together with the synthetic open and synthetic typical value.
Synthetic High
The maximum of:
smoothed high;
synthetic open;
synthetic typical.
Synthetic Low
The minimum of:
smoothed low;
synthetic open;
synthetic typical.
These values define the working synthetic price range used by the trend-line calculation.
4. Synthetic Mid-Line
The midpoint of the synthetic range is calculated as:
Mid-Line = Synthetic Low +
(Synthetic High − Synthetic Low) / 2
This is equivalent to the midpoint between the custom synthetic high and low.
The mid-line is then smoothed again using an EMA.
The default secondary smoothing length is:
2 bars
The result is plotted as the primary visible trend line.
5. Trend-Line Direction
The color of the main trend line is determined by the relationship between:
synthetic open;
synthetic typical price.
Bullish synthetic structure
When:
Synthetic Open < Synthetic Typical
the structure is interpreted as bullish.
Bearish synthetic structure
When:
Synthetic Open > Synthetic Typical
the structure is interpreted as bearish.
The trend line therefore provides a continuous visual representation of the direction calculated from the custom synthetic price series.
6. Secondary Smoothing
The Smooth parameter controls the final EMA applied to the synthetic midpoint.
Default:
2
Lower value
Produces:
faster trend-line response;
closer tracking of short-term movement;
potentially more directional changes.
Higher value
Produces:
smoother trend line;
slower reaction;
stronger filtering of small changes.
This parameter affects the displayed synthetic trend line.
It is separate from the HA Period used to smooth the original OHLC values.
7. SuperTrend Confirmation Filter
The second major component is TradingView's ATR-based SuperTrend calculation.
The SuperTrend uses two user-configurable parameters:
ATR Period
Factor
Default values:
ATR Period = 2
Factor = 2.0
SuperTrend constructs volatility-adjusted trailing boundaries around price.
The active trend direction changes when price moves sufficiently through the corresponding volatility boundary.
8. SuperTrend Direction
The script interprets the SuperTrend direction as:
Bullish
stDir < 0
Bearish
stDir > 0
The active bullish or bearish SuperTrend line is plotted independently.
A lightly shaded area between candle midpoint and the active SuperTrend boundary provides additional visual context.
9. ATR Period
The ATR Period controls how quickly the volatility measurement reacts to changing market conditions.
The default value is relatively short:
2 periods
Smaller ATR Period
Generally creates:
faster volatility adaptation;
more responsiveness to recent price movement.
Larger ATR Period
Generally creates:
smoother ATR values;
slower adaptation;
less sensitivity to individual short-term volatility changes.
Because the default setting is intentionally responsive, users should test longer ATR periods when applying the indicator to noisier instruments or lower timeframes.
10. SuperTrend Factor
The Factor controls the distance of the SuperTrend boundary from price.
Conceptually:
SuperTrend distance ∝ ATR × Factor
Therefore:
Lower Factor
Generally produces:
tighter SuperTrend boundaries;
faster trend changes;
more frequent directional transitions;
increased sensitivity to noise.
Higher Factor
Generally produces:
wider boundaries;
slower trend changes;
fewer transitions;
stronger filtering of smaller price movements.
So, similar to the Sensitivity concept in the previous indicators:
Higher Factor = generally fewer/slower SuperTrend transitions.
Lower Factor = generally more/faster transitions.
11. Dual-Confirmation Signal Logic
Signals require directional agreement between the synthetic price structure and SuperTrend.
Bullish agreement
A bullish state exists when:
synthetic open is below synthetic typical;
AND SuperTrend is bullish.
In simplified form:
Synthetic Bullish + SuperTrend Bullish = Long State
Bearish agreement
A bearish state exists when:
synthetic open is above synthetic typical;
AND SuperTrend is bearish.
In simplified form:
Synthetic Bearish + SuperTrend Bearish = Short State
Neither condition alone produces a signal.
12. Buy Signals
A Buy label appears when the indicator transitions into a new bullish agreement state.
This requires:
bullish synthetic trend;
bullish SuperTrend;
the combined bullish condition was not active on the previous bar;
the previous stored signal state was not already bullish.
Once the bullish state is recorded, repeated Buy labels are suppressed until the indicator first transitions into the opposite directional state.
This prevents the indicator from printing a Buy label on every bullish candle.
13. Sell Signals
A Sell label follows the inverse logic.
It requires:
bearish synthetic trend;
bearish SuperTrend;
a new bearish agreement state;
the previous stored state not already being bearish.
The persistent signal-state variable therefore allows the indicator to mark directional transitions rather than continuous conditions.
14. Why Two Trend Components Are Used
The two components measure trend differently.
Component Main role
Smoothed OHLC Reduces raw candle noise
Synthetic structure Measures directional price relationship
Synthetic trend line Visualizes smoothed structural direction
ATR/SuperTrend Volatility-adjusted trend confirmation
State engine Prevents duplicate signals
Buy/Sell labels Marks changes in confirmed direction
The synthetic component is derived primarily from smoothed price structure.
SuperTrend is driven by price plus volatility.
Requiring agreement therefore attempts to avoid treating a change in either calculation alone as sufficient confirmation.
15. Example Bullish Interpretation
Suppose the synthetic trend changes bullish.
That condition alone does not immediately require a Buy label.
The indicator also evaluates SuperTrend.
If SuperTrend remains bearish, the two systems disagree and no bullish signal is generated.
When both eventually satisfy:
Synthetic Trend = Bullish
and
SuperTrend = Bullish
a new bullish combined state can generate a Buy signal.
This structure is intended to filter some early synthetic transitions that occur before volatility-adjusted trend confirmation.
16. Example Bearish Interpretation
The same process applies inversely.
A bearish synthetic trend is insufficient by itself.
The SuperTrend direction must also be bearish.
Once both components agree and the indicator transitions from its previous state, a Sell signal can be displayed.
17. Signal Frequency
Signal frequency depends primarily on three parameters.
HA Period
Controls initial OHLC smoothing.
Higher values generally produce slower synthetic directional changes.
Smooth
Controls final smoothing of the synthetic midpoint trend line.
Higher values produce a smoother displayed trend line.
SuperTrend Factor
Controls volatility-boundary distance.
Higher values generally require a larger price movement before SuperTrend changes direction.
Because these parameters affect different parts of the framework, they should not be interpreted as interchangeable sensitivity controls.
18. Suggested Starting Parameters
The default configuration is:
HA Period: 14
Smooth: 2
ATR Period: 2
Factor: 2.0
These values provide a relatively responsive configuration.
Users working with particularly noisy instruments or very short timeframes may wish to test:
longer HA Periods;
longer ATR Periods;
larger SuperTrend Factors.
Users wanting faster response can experiment with smaller values.
No parameter combination is universally optimal.
19. Trend Line vs Signal
The main synthetic trend line and the Buy/Sell signals should not be interpreted as the same feature.
The trend line continuously reflects the synthetic structure.
Signals require additional SuperTrend agreement.
Therefore, the trend line can change directional state before a Buy or Sell label appears.
This difference is intentional.
20. Alerts
The indicator provides two alert conditions:
Buy Signal
Sell Signal
The Buy alert corresponds to a new bullish combined state.
The Sell alert corresponds to a new bearish combined state.
Alerts indicate only that the programmed conditions have been met.
They do not constitute independent trade recommendations.
21. Real-Time Behavior
The indicator evaluates information from the currently developing candle.
Consequently, conditions can evolve while a live candle is still open.
For traders who require confirmed signals, the safest interpretation is to evaluate the signal after the corresponding chart candle has closed.
The indicator should therefore not be marketed as universally non-repainting without additional restrictions or testing.
Historical conditions are naturally evaluated using completed bars, while a live candle can still change before closure.
22. No Higher-Timeframe Data Dependency
The current version does not request external symbols or higher-timeframe series.
Its calculations are based on the OHLC and volatility information of the chart on which it is applied.
This makes the indicator simpler than a multi-timeframe framework, but its behavior will still differ substantially according to the selected chart timeframe.
23. Timeframe Considerations
On lower timeframes:
market noise is greater;
synthetic trend changes may occur more frequently;
short ATR periods are more reactive;
SuperTrend reversals can occur more often.
On higher timeframes:
signals generally develop more slowly;
each transition represents a larger amount of underlying price movement.
Parameter values should therefore be evaluated independently for each timeframe and market.
24. Limitations
Alpha Trend Hunter is a reactive trend indicator.
It does not predict future price.
The underlying calculations use:
historical price;
current price;
moving averages;
ATR;
recursive synthetic values.
These calculations inherently react after price information becomes available.
A stronger degree of smoothing generally decreases noise but also increases lag.
25. Sideways-Market Limitation
The indicator is fundamentally trend-oriented.
During sideways or rapidly alternating conditions, both synthetic trend calculations and SuperTrend can produce repeated directional transitions.
The dual-confirmation requirement can reduce some isolated changes, but it cannot eliminate whipsaw risk.
The indicator does not contain a dedicated ADX or market-regime filter in its current version.
26. Risk Management
The indicator does not calculate:
position size;
account risk;
stop-loss placement;
reward/risk targets;
portfolio exposure.
Users must determine risk independently.
A Buy or Sell label indicates only a transition in the indicator's defined directional state.
27. What Alpha Trend Hunter Does Not Do
Alpha Trend Hunter does not:
execute orders;
connect to a brokerage account;
manage positions;
guarantee profitable signals;
predict exact tops or bottoms;
guarantee trend continuation;
identify institutional activity;
determine appropriate leverage;
determine individualized risk.
It is a technical-analysis and trend-visualization tool.
28. Intended Use
A practical workflow is:
use the synthetic trend line to observe the underlying smoothed direction;
observe the SuperTrend volatility regime;
wait for agreement between both components;
use the Buy/Sell transition as confirmation that a new combined state has formed;
evaluate market structure and personal risk independently before making any trading decision.
The indicator is designed to answer:
“Are smoothed price structure and volatility-adjusted trend currently pointing in the same direction?”
rather than:
“Will the next trade be profitable?”
Educational Purpose
Alpha Trend Hunter is intended for technical analysis, research and educational use.
Users should independently consider:
price structure;
volatility;
liquidity;
economic events;
timeframe;
execution conditions;
risk management.
Historical signals do not guarantee future results.
リリースノート
small layout issue resolved 
PropTraderz
免責事項
これらの情報および投稿は、TradingViewが提供または承認する金融、投資、取引、またはその他の種類の助言もしくは推奨であることを意図したものではなく、またこれらに該当するものでもありません。詳細は利用規約をご覧ください。
PropTraderz
免責事項
これらの情報および投稿は、TradingViewが提供または承認する金融、投資、取引、またはその他の種類の助言もしくは推奨であることを意図したものではなく、またこれらに該当するものでもありません。詳細は利用規約をご覧ください。