アップデート済
Therlastr Fixed TP Dashboard
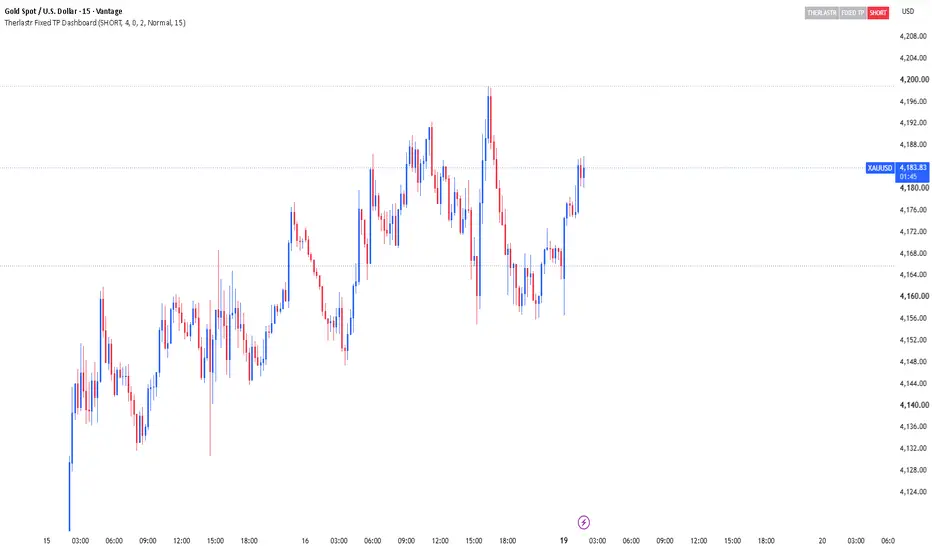
Therlastr Fixed TP Dashboard is a simple, customizable trading tool built to help traders plan and visualize their trade levels directly on the TradingView chart.
You set your trade direction, entry price, stop loss, and fixed take-profit distance, and the dashboard automatically calculates five take-profit targets, shows risk and risk-to-reward ratios, and draws the levels on the chart. It’s designed for better organization, clean visuals, and clear trade planning. Important: this indicator does not open or close trades and does not move your stop loss automatically. All price levels are based on your inputs or calculated from them,
so always use proper risk management and confirm decisions with.
You set your trade direction, entry price, stop loss, and fixed take-profit distance, and the dashboard automatically calculates five take-profit targets, shows risk and risk-to-reward ratios, and draws the levels on the chart. It’s designed for better organization, clean visuals, and clear trade planning. Important: this indicator does not open or close trades and does not move your stop loss automatically. All price levels are based on your inputs or calculated from them,
so always use proper risk management and confirm decisions with.
リリースノート
Therlastr Fixed TP Dashboard is a simple, customizable trading tool built to help traders plan and visualize their trade levels directly on the TradingView chart.You set your trade direction, entry price, stop loss, and fixed take-profit distance, and the dashboard automatically calculates five take-profit targets, shows risk and risk-to-reward ratios, and draws the levels on the chart. It’s designed for better organization, clean visuals, and clear trade planning. Important: this indicator does not open or close trades and does not move your stop loss automatically. All price levels are based on your inputs or calculated from them,
so always use proper risk management and confirm decisions with.
リリースノート
Therlastr Fixed TP Dashboard is a simple, customizable trading tool built to help traders plan and visualize their trade levels directly on the TradingView chart.You set your trade direction, entry price, stop loss, and fixed take-profit distance, and the dashboard automatically calculates five take-profit targets, shows risk and risk-to-reward ratios, and draws the levels on the chart. It’s designed for better organization, clean visuals, and clear trade planning. Important: this indicator does not open or close trades and does not move your stop loss automatically. All price levels are based on your inputs or calculated from them,
so always use proper risk management and confirm decisions with.

免責事項
これらの情報および投稿は、TradingViewが提供または承認する金融、投資、取引、またはその他の種類の助言もしくは推奨であることを意図したものではなく、またこれらに該当するものでもありません。詳細は利用規約をご覧ください。
免責事項
これらの情報および投稿は、TradingViewが提供または承認する金融、投資、取引、またはその他の種類の助言もしくは推奨であることを意図したものではなく、またこれらに該当するものでもありません。詳細は利用規約をご覧ください。