Least Sideways Ranker [AlgoChief]
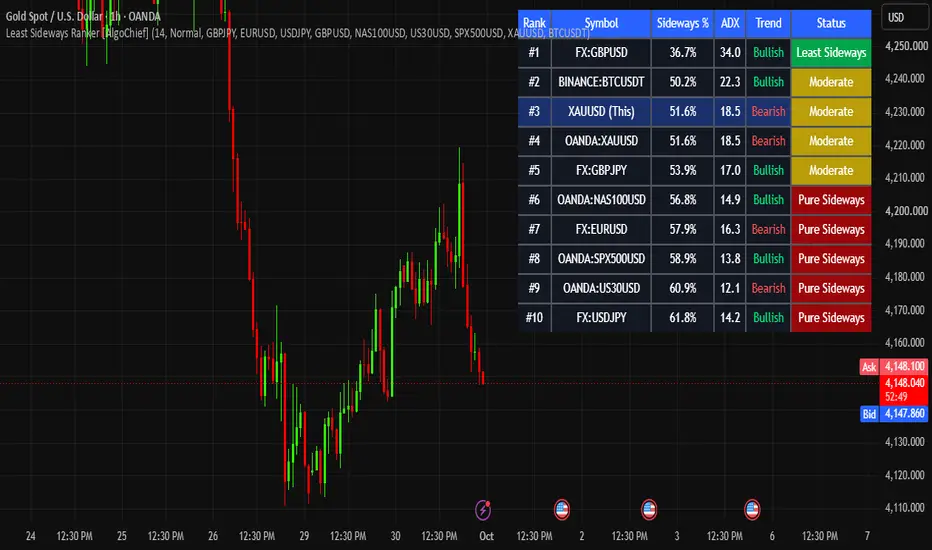
Trading in sideways or choppy markets is one of the leading causes of drawdowns, whipsaws, and theta decay for option buyers and breakout traders. The Least Sideways Ranker solves this problem by scanning up to 10 customizable assets in real time and automatically ranking them from the least sideways (strongest one-way trend) to the most sideways (consolidation/chop).
Regardless of which chart you apply this indicator to, the dynamic dashboard immediately highlights your current active chart relative to the rest of the watchlist, helping you decide whether to take directional trades or stay aside.
HOW THE CALCULATION WORKS
The ranking engine combines two proven mathematical concepts to filter out market noise and quantify market state:
Choppiness Index (CHOP) The Choppiness Index measures whether the market is moving directionally or consolidating. A lower Choppiness value indicates that price is expanding over a wider range with minimal overlap, signaling a clean trending market.
Average Directional Index (ADX) ADX measures the strength of the prevailing trend without regard to direction. Higher ADX readings indicate robust directional momentum, while readings below 20 represent a weak, directionless market.
Composite Sidewaysness Percentage Both indicators are combined into a normalized 0% to 100% Sidewaysness Score: Sidewaysness % = (Choppiness Index * 0.6) + (Inverted ADX Component * 0.4)
A lower percentage score means less sideways movement and stronger trend momentum. The table automatically sorts all assets in ascending order, placing the asset with the cleanest trend at Rank 1.
HOW TO READ THE TABLE
Rank: Rank 1 represents the symbol with the least sideways action and highest active momentum across your watchlist.
Symbol: Displays the ticker symbol. The chart you are currently viewing is automatically labeled as (This) and highlighted in blue.
Sideways %:
Under 38% (Green): Least Sideways. Strong directional price expansion.
38% to 55% (Yellow): Moderate state. Balanced between trend and pullback.
Over 55% (Red): Pure Sideways. High consolidation and choppy price action.
ADX: Shows the current directional strength value for each symbol.
Trend: Identifies whether the underlying directional pressure is Bullish or Bearish using directional movement indicators (+DI / -DI).
Status: Provides an instant visual summary (Least Sideways, Moderate, Pure Sideways).
TRADING APPLICATIONS
Breakout and Momentum Traders: Focus primarily on Rank 1, 2, and 3 assets. These instruments have the lowest chop and highest likelihood of follow-through on breakout levels.
Option Buyers: Trade assets showing Green / Least Sideways status to minimize premium decay caused by flat, rangebound markets.
Filter False Breakouts: If your target asset is ranked near the bottom with a Sideways % above 55%, avoid taking directional breakout trades, as the probability of a fakeout is elevated.
CUSTOMIZATION OPTIONS
Calculation Period: Adjust the length for the Choppiness Index and ADX calculations (default is 14).
Table Size: Switch between Normal, Large, and Huge to fit different screen resolutions and laptop displays.
Watchlist Symbols: Customize up to 9 external symbols across Indices, Forex pairs, Crypto, Commodities, or Stocks directly from the settings panel.
DISCLAIMER
This indicator is designed purely for educational and analytical purposes. It does not provide automated buy or sell recommendations. Past market behavior and statistical ranking do not guarantee future price performance. Always implement proper risk management and position sizing.

For access & queries: algochiefsupport@gmail.com
免責事項
これらの情報および投稿は、TradingViewが提供または承認する金融、投資、取引、またはその他の種類の助言もしくは推奨であることを意図したものではなく、またこれらに該当するものでもありません。詳細は利用規約をご覧ください。
For access & queries: algochiefsupport@gmail.com
免責事項
これらの情報および投稿は、TradingViewが提供または承認する金融、投資、取引、またはその他の種類の助言もしくは推奨であることを意図したものではなく、またこれらに該当するものでもありません。詳細は利用規約をご覧ください。