PINE LIBRARY
更新済 MonthlyPerformanceV2
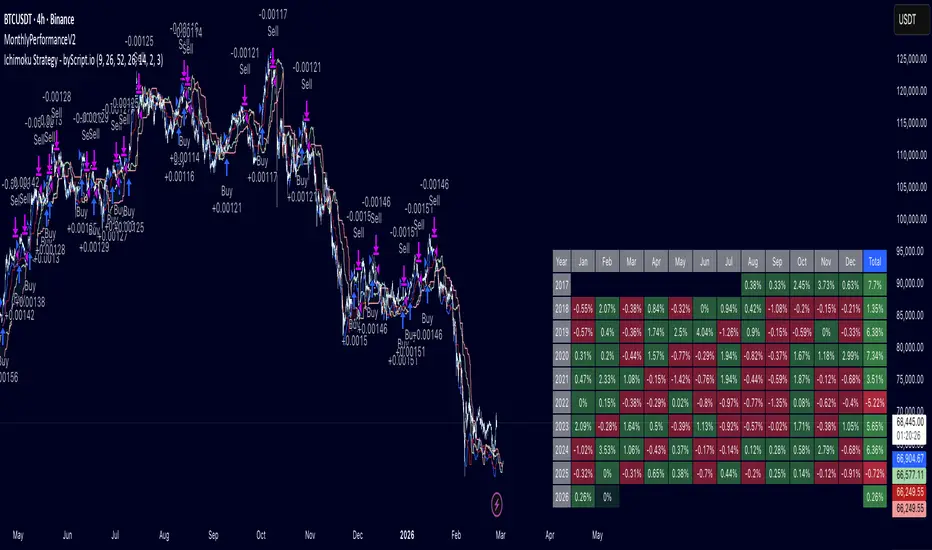
This library provides a plug-and-play monthly performance table for strategy scripts.
It automatically tracks and displays profit/loss per month and year directly on your chart.
─────────────────────────────────────
🔧 FUNCTION
─────────────────────────────────────
trackAndDraw(initialCapital, showInPercentage)
Parameters:
- initialCapital (float) — The starting capital of your strategy.
Tip: use `strategy.initial_capital` for automatic sync.
- showInPercentage (bool) — Display mode:
`true` → shows monthly result in % (compounding)
`false` → shows monthly result in USD (normalized to initial capital)
─────────────────────────────────────
📊 FEATURES
─────────────────────────────────────
- Compounding % calculation per month and per year
- Dual display mode: percentage or USD equivalent
- Color-coded cells (green / red) for quick visual reading
- Running month tracker (current open month, lighter color)
- Annual total column with compounding yearly return
- Auto-limits display to the 19 most recent years to prevent table overflow
─────────────────────────────────────
🚀 HOW TO USE
─────────────────────────────────────
add this 2 lines code to your script
import edwinardyanto/MonthlyPerformance/1 as mp
mp.trackAndDraw(strategy.initial_capital, true)
─────────────────────────────────────
📌 NOTES
─────────────────────────────────────
- Only compatible with strategy scripts (requires strategy.equity)
- Call trackAndDraw() once, outside any conditional block
- Table is displayed at bottom-right of the chart
- Older years beyond the 19-year limit are excluded from display
but still calculated internally
It automatically tracks and displays profit/loss per month and year directly on your chart.
─────────────────────────────────────
🔧 FUNCTION
─────────────────────────────────────
trackAndDraw(initialCapital, showInPercentage)
Parameters:
- initialCapital (float) — The starting capital of your strategy.
Tip: use `strategy.initial_capital` for automatic sync.
- showInPercentage (bool) — Display mode:
`true` → shows monthly result in % (compounding)
`false` → shows monthly result in USD (normalized to initial capital)
─────────────────────────────────────
📊 FEATURES
─────────────────────────────────────
- Compounding % calculation per month and per year
- Dual display mode: percentage or USD equivalent
- Color-coded cells (green / red) for quick visual reading
- Running month tracker (current open month, lighter color)
- Annual total column with compounding yearly return
- Auto-limits display to the 19 most recent years to prevent table overflow
─────────────────────────────────────
🚀 HOW TO USE
─────────────────────────────────────
add this 2 lines code to your script
import edwinardyanto/MonthlyPerformance/1 as mp
mp.trackAndDraw(strategy.initial_capital, true)
─────────────────────────────────────
📌 NOTES
─────────────────────────────────────
- Only compatible with strategy scripts (requires strategy.equity)
- Call trackAndDraw() once, outside any conditional block
- Table is displayed at bottom-right of the chart
- Older years beyond the 19-year limit are excluded from display
but still calculated internally
リリースノート
v2better visual
Pineライブラリ
TradingViewの精神に則り、作者はこのPineコードをオープンソースライブラリとして公開してくれました。コミュニティの他のPineプログラマーが再利用できるようにという配慮です。作者に拍手を!このライブラリは個人利用や他のオープンソースの公開コンテンツで使用できますが、公開物でのコードの再利用はハウスルールに準じる必要があります。

免責事項
これらの情報および投稿は、TradingViewが提供または承認する金融、投資、取引、またはその他の種類の助言もしくは推奨であることを意図したものではなく、またこれらに該当するものでもありません。詳細は利用規約をご覧ください。
Pineライブラリ
TradingViewの精神に則り、作者はこのPineコードをオープンソースライブラリとして公開してくれました。コミュニティの他のPineプログラマーが再利用できるようにという配慮です。作者に拍手を!このライブラリは個人利用や他のオープンソースの公開コンテンツで使用できますが、公開物でのコードの再利用はハウスルールに準じる必要があります。
免責事項
これらの情報および投稿は、TradingViewが提供または承認する金融、投資、取引、またはその他の種類の助言もしくは推奨であることを意図したものではなく、またこれらに該当するものでもありません。詳細は利用規約をご覧ください。