OPEN-SOURCE SCRIPT
更新済 Fibonacci Order Blocks [yigdeli]
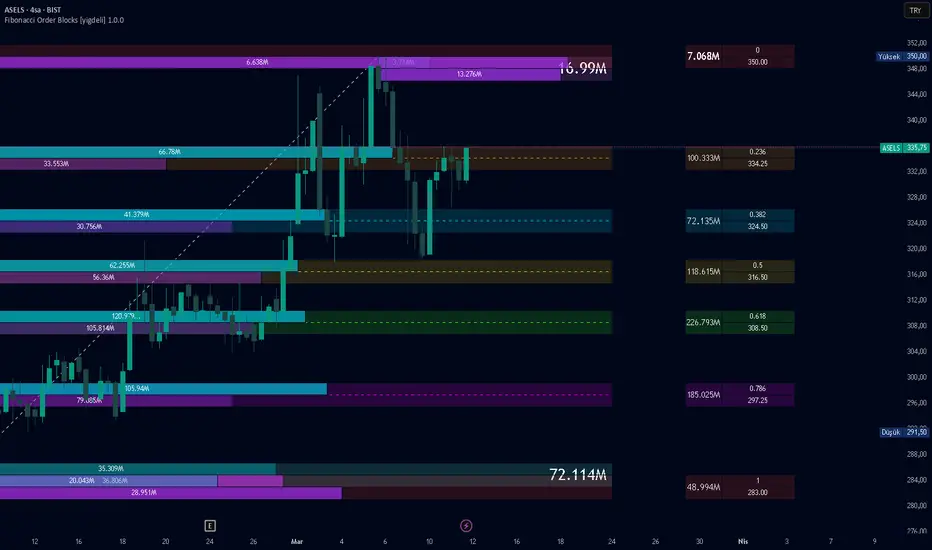
Fibonacci Order Blocks [yigdeli]
Overview
Fibonacci Order Blocks is a rule-based structural analysis and visualization tool that combines pivot-based Fibonacci mapping with volume-distributed support and resistance zones.
The Fibonacci foundation used in this script was built on auto Fibonacci correction techniques available on TradingView. Thanks to the original technical groundwork and to the TradingView Pine community for the structural ideas that helped shape this project. On top of that base, this script extends the framework with Fibonacci zone boxes, internal buy/sell volume split, right-side information boxes, and support/resistance order block visualization.
This script is designed for structural chart analysis and visual interpretation.
It does not predict future price direction.
It does not provide standalone entry or exit signals.
It does not provide investment advice.
Fibonacci Structure
The script automatically builds a Fibonacci leg between the latest confirmed structural pivots.
Each enabled Fibonacci level can display:
the Fibonacci line itself
a local main zone box
a buy-side sub-box
a sell-side sub-box
This makes each level readable as a price zone rather than as a line only.
Image 1 — Fibonacci Lines

Shows the pivot-based Fibonacci structure used as the main framework of the script.
Image 2 — Fibonacci Level Boxes

Shows the Fibonacci main boxes and the internal buy/sell sub-boxes for enabled levels.
Fibonacci Information Boxes
Each Fibonacci zone can also display separate right-side information boxes.
These boxes are used to show:
total volume for the zone
Fibonacci level value
exact price value
They are separated from the main Fibonacci box to improve readability and make the chart easier to interpret visually.
Image 3 — Fibonacci Info Boxes

Shows the separate total-volume box and the level/price information boxes displayed to the right of Fibonacci zones.
Support and Resistance Zones
The indicator also builds structural support and resistance zones using the active chart context and lookback settings.
Each zone includes:
a main support or resistance box
total zone volume displayed on the main box
internal buy and sell sub-boxes
These zones are intended to help visualize how localized volume is distributed inside broader structural areas.
Image 4 — Support and Resistance Zones

Shows the main support and resistance block structure.
Internal Buy / Sell Volume Split
Both Fibonacci zones and support/resistance zones use internal buy/sell volume distribution logic.
This volume split is derived from historical chart data and internal overlap calculations. It is a chart-based analytical representation, not exchange-native bid/ask data and not a direct order book feed.
The purpose of the split is to provide visual context about how volume is distributed inside each displayed zone.
Image 5 — Support / Resistance Buy-Sell Split


Shows the complete box-based layout of the script, including Fibonacci zone boxes, buy/sell sub-boxes, right-side information boxes, and support/resistance volume blocks.
Customization
The script includes adjustable settings for:
pivot detection behavior
Fibonacci direction and extension
visible Fibonacci levels
line style and colors
support/resistance colors
volume box widths
right-side info box widths
support/resistance lookback behavior
This allows users to adapt the visualization to different chart layouts and analysis preferences.
What This Script Does Not Do
It does not forecast future price levels
It does not guarantee reversals or continuations
It does not generate standalone trading signals
It does not provide broker, exchange, or true order book execution data
It does not provide financial advice or trading recommendations
Notes
All calculations are derived from chart data, user-defined settings, and rule-based internal logic.
This script should be used as a structural and visual analysis tool. It is intended to help users study price structure, Fibonacci mapping, and localized volume behavior inside predefined zones.
Overview
Fibonacci Order Blocks is a rule-based structural analysis and visualization tool that combines pivot-based Fibonacci mapping with volume-distributed support and resistance zones.
The Fibonacci foundation used in this script was built on auto Fibonacci correction techniques available on TradingView. Thanks to the original technical groundwork and to the TradingView Pine community for the structural ideas that helped shape this project. On top of that base, this script extends the framework with Fibonacci zone boxes, internal buy/sell volume split, right-side information boxes, and support/resistance order block visualization.
This script is designed for structural chart analysis and visual interpretation.
It does not predict future price direction.
It does not provide standalone entry or exit signals.
It does not provide investment advice.
Fibonacci Structure
The script automatically builds a Fibonacci leg between the latest confirmed structural pivots.
Each enabled Fibonacci level can display:
the Fibonacci line itself
a local main zone box
a buy-side sub-box
a sell-side sub-box
This makes each level readable as a price zone rather than as a line only.
Image 1 — Fibonacci Lines
Shows the pivot-based Fibonacci structure used as the main framework of the script.
Image 2 — Fibonacci Level Boxes
Shows the Fibonacci main boxes and the internal buy/sell sub-boxes for enabled levels.
Fibonacci Information Boxes
Each Fibonacci zone can also display separate right-side information boxes.
These boxes are used to show:
total volume for the zone
Fibonacci level value
exact price value
They are separated from the main Fibonacci box to improve readability and make the chart easier to interpret visually.
Image 3 — Fibonacci Info Boxes
Shows the separate total-volume box and the level/price information boxes displayed to the right of Fibonacci zones.
Support and Resistance Zones
The indicator also builds structural support and resistance zones using the active chart context and lookback settings.
Each zone includes:
a main support or resistance box
total zone volume displayed on the main box
internal buy and sell sub-boxes
These zones are intended to help visualize how localized volume is distributed inside broader structural areas.
Image 4 — Support and Resistance Zones
Shows the main support and resistance block structure.
Internal Buy / Sell Volume Split
Both Fibonacci zones and support/resistance zones use internal buy/sell volume distribution logic.
This volume split is derived from historical chart data and internal overlap calculations. It is a chart-based analytical representation, not exchange-native bid/ask data and not a direct order book feed.
The purpose of the split is to provide visual context about how volume is distributed inside each displayed zone.
Image 5 — Support / Resistance Buy-Sell Split
Shows the complete box-based layout of the script, including Fibonacci zone boxes, buy/sell sub-boxes, right-side information boxes, and support/resistance volume blocks.
Customization
The script includes adjustable settings for:
pivot detection behavior
Fibonacci direction and extension
visible Fibonacci levels
line style and colors
support/resistance colors
volume box widths
right-side info box widths
support/resistance lookback behavior
This allows users to adapt the visualization to different chart layouts and analysis preferences.
What This Script Does Not Do
It does not forecast future price levels
It does not guarantee reversals or continuations
It does not generate standalone trading signals
It does not provide broker, exchange, or true order book execution data
It does not provide financial advice or trading recommendations
Notes
All calculations are derived from chart data, user-defined settings, and rule-based internal logic.
This script should be used as a structural and visual analysis tool. It is intended to help users study price structure, Fibonacci mapping, and localized volume behavior inside predefined zones.
リリースノート
Added a new Box Text Size setting for box-based elements.Text inside the volume and information boxes can now be adjusted with the following options:
Auto, Small, Normal, Large, and Huge
This update improves readability across different chart layouts, screen sizes, and user preferences.
オープンソーススクリプト
TradingViewの精神に則り、このスクリプトの作者はコードをオープンソースとして公開してくれました。トレーダーが内容を確認・検証できるようにという配慮です。作者に拍手を送りましょう!無料で利用できますが、コードの再公開はハウスルールに従う必要があります。

All scripts & content provided by yigdeli are for informational & educational purposes only.
免責事項
これらの情報および投稿は、TradingViewが提供または承認する金融、投資、取引、またはその他の種類の助言もしくは推奨であることを意図したものではなく、またこれらに該当するものでもありません。詳細は利用規約をご覧ください。
オープンソーススクリプト
TradingViewの精神に則り、このスクリプトの作者はコードをオープンソースとして公開してくれました。トレーダーが内容を確認・検証できるようにという配慮です。作者に拍手を送りましょう!無料で利用できますが、コードの再公開はハウスルールに従う必要があります。
All scripts & content provided by yigdeli are for informational & educational purposes only.
免責事項
これらの情報および投稿は、TradingViewが提供または承認する金融、投資、取引、またはその他の種類の助言もしくは推奨であることを意図したものではなく、またこれらに該当するものでもありません。詳細は利用規約をご覧ください。