Multi EMA SMA Pro - 5/13/20/50/100/200 - MTF
MULTI EMA/SMA PRO — 5/13/20/50/100/200 + MTF
Nine independent moving averages in one indicator, each with its own length,
type, timeframe, color and width. Defaults give you the classic 20 / 50 / 100 /
200 on your chart timeframe, with 5 and 13 a click away.
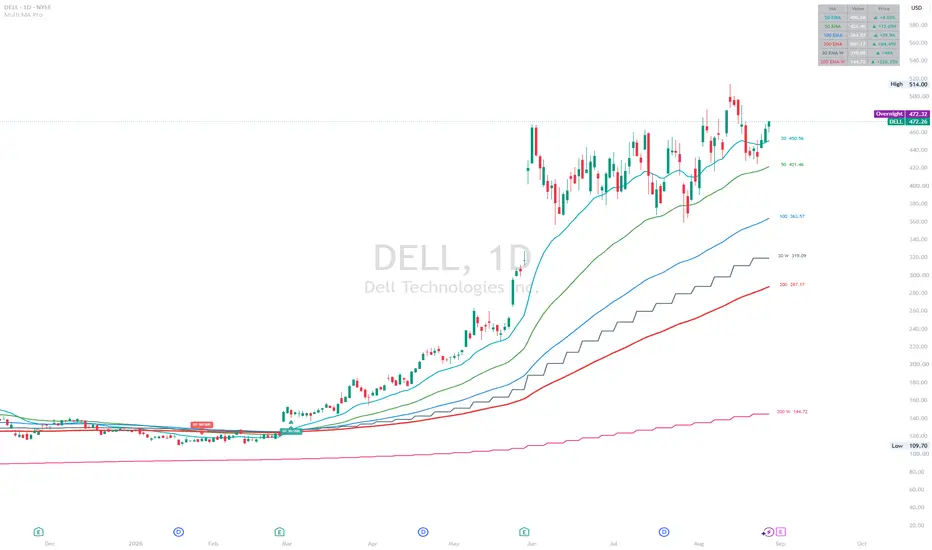
EVERY LINE IS LABELLED
No more guessing which line is which. Each average is tagged at the right edge
with its length — and optionally its type, its timeframe, its current value, and
how far price sits from it in percent. You read "200 D +18.06%" straight off the
chart instead of hovering over lines to find out.
DAILY / WEEKLY / MONTHLY AVERAGES ON ANY CHART
Every slot has a Chart / Daily / Weekly / Monthly / Custom selector, so you can
sit on a 5-minute chart and still see exactly where the daily 200 and the weekly
200 are — the levels that actually decide intraday reversals. Slots 7, 8 and 9
come pre-set to 200 D, 30 W and 200 W. Each higher-timeframe line is tagged with
D, W or M so there is never any ambiguity about what you are looking at. Ask for
a timeframe below your chart and the slot quietly falls back to chart data rather
than returning misleading values.
INFO TABLE
An on-chart panel lists every enabled average, its current value, and how far
price is above or below it in percent, color-coded green and red. It is the
fastest way to tell whether price is extended and due a snap back, or resting on
support. Decimal precision is adjustable.
GOLDEN CROSS / DEATH CROSS, DONE PROPERLY
GC/DC detection is on by default and measured on the DAILY 50 vs 200 no matter
what timeframe you are viewing — so an intraday chart shows the real cross, not a
5-minute imitation of one. Markers carry their own context: "GC 50/200 D".
Lengths, timeframe and MA type are all configurable, or you can point the cross
logic at any two of your plotted lines instead.
EVERYTHING ELSE
- EMA / SMA / WMA / HMA / RMA / VWMA globally, or overridden per line
- Custom source, plot offset, transparency, per-line width and color
- Line / step-line / circles / cross plot styles
- Slope-based coloring (green rising, red falling)
- Ribbon fill between any two averages
- Alerts for price crossing each average, plus golden and death cross
- Palette chosen to stay readable on both light and dark chart backgrounds
A NOTE ON HIGHER-TIMEFRAME DATA
Leave "wait for bar close" off and the daily and weekly lines update live inside
the forming candle, which is usually what you want when trading. The trade-off is
that an intraday cross can appear and then disappear before the session closes.
Turn it on for confirmed, non-repainting values that step one bar late.
If you find this useful, a boost is appreciated. Suggestions and feedback welcome in the comments.
Open-source — feel free to study, fork, and adapt.
Nine independent moving averages in one indicator, each with its own length,
type, timeframe, color and width. Defaults give you the classic 20 / 50 / 100 /
200 on your chart timeframe, with 5 and 13 a click away.
EVERY LINE IS LABELLED
No more guessing which line is which. Each average is tagged at the right edge
with its length — and optionally its type, its timeframe, its current value, and
how far price sits from it in percent. You read "200 D +18.06%" straight off the
chart instead of hovering over lines to find out.
DAILY / WEEKLY / MONTHLY AVERAGES ON ANY CHART
Every slot has a Chart / Daily / Weekly / Monthly / Custom selector, so you can
sit on a 5-minute chart and still see exactly where the daily 200 and the weekly
200 are — the levels that actually decide intraday reversals. Slots 7, 8 and 9
come pre-set to 200 D, 30 W and 200 W. Each higher-timeframe line is tagged with
D, W or M so there is never any ambiguity about what you are looking at. Ask for
a timeframe below your chart and the slot quietly falls back to chart data rather
than returning misleading values.
INFO TABLE
An on-chart panel lists every enabled average, its current value, and how far
price is above or below it in percent, color-coded green and red. It is the
fastest way to tell whether price is extended and due a snap back, or resting on
support. Decimal precision is adjustable.
GOLDEN CROSS / DEATH CROSS, DONE PROPERLY
GC/DC detection is on by default and measured on the DAILY 50 vs 200 no matter
what timeframe you are viewing — so an intraday chart shows the real cross, not a
5-minute imitation of one. Markers carry their own context: "GC 50/200 D".
Lengths, timeframe and MA type are all configurable, or you can point the cross
logic at any two of your plotted lines instead.
EVERYTHING ELSE
- EMA / SMA / WMA / HMA / RMA / VWMA globally, or overridden per line
- Custom source, plot offset, transparency, per-line width and color
- Line / step-line / circles / cross plot styles
- Slope-based coloring (green rising, red falling)
- Ribbon fill between any two averages
- Alerts for price crossing each average, plus golden and death cross
- Palette chosen to stay readable on both light and dark chart backgrounds
A NOTE ON HIGHER-TIMEFRAME DATA
Leave "wait for bar close" off and the daily and weekly lines update live inside
the forming candle, which is usually what you want when trading. The trade-off is
that an intraday cross can appear and then disappear before the session closes.
Turn it on for confirmed, non-repainting values that step one bar late.
If you find this useful, a boost is appreciated. Suggestions and feedback welcome in the comments.
Open-source — feel free to study, fork, and adapt.

免責事項
これらの情報および投稿は、TradingViewが提供または承認する金融、投資、取引、またはその他の種類の助言もしくは推奨であることを意図したものではなく、またこれらに該当するものでもありません。詳細は利用規約をご覧ください。
免責事項
これらの情報および投稿は、TradingViewが提供または承認する金融、投資、取引、またはその他の種類の助言もしくは推奨であることを意図したものではなく、またこれらに該当するものでもありません。詳細は利用規約をご覧ください。