OPEN-SOURCE SCRIPT
Options Strikes
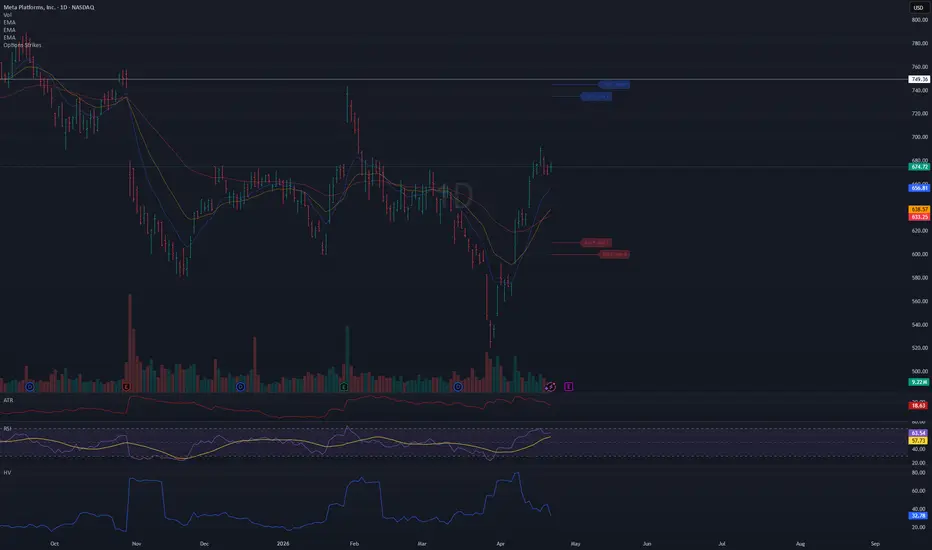
● Title: Options Strikes
Short description:
Visualize your open options positions on any chart — horizontal lines from entry to expiration, color-coded by Put/Call.
---
Full description:
Track up to 8 options contracts directly on your price chart. Each contract draws a horizontal line from your open date to the expiration date (4:00 PM ET), so you always see where your strikes sit relative to price and how much time is left.
Features
- Up to 8 contracts simultaneously — Put and Call
- Lines run from your open date to 4:00 PM ET on expiration day
- Puts in red, Calls in blue (colors and opacity customizable)
- Compact label at the end of each line: 610 P May 1
- Labels can be toggled on/off
- Calendar pickers for both Open date and Expiration date
- Auto-enable — a contract activates as soon as you enter a Strike value; set Strike to 0 to disable it
- Ticker filter — set a symbol (e.g. META) so lines only appear on that specific chart, useful when switching between
tickers
- Works on any symbol and any timeframe
How to use
1. Add the indicator to your chart
2. Open Settings → Inputs
3. For each contract: enter a Strike, select Type (Put/Call), pick Open date and Exp date
4. The line appears automatically — no need to toggle anything
5. Optionally set the Ticker field to lock this instance to a specific symbol
Tips
- Leave Ticker blank → lines show on every chart
- Open date defaults to today — change it only if you entered the position on a previous day
- To remove a contract, set its Strike back to 0
- Use contracts 5–8 for additional positions
- Adjust colors and line width in the Style group
Short description:
Visualize your open options positions on any chart — horizontal lines from entry to expiration, color-coded by Put/Call.
---
Full description:
Track up to 8 options contracts directly on your price chart. Each contract draws a horizontal line from your open date to the expiration date (4:00 PM ET), so you always see where your strikes sit relative to price and how much time is left.
Features
- Up to 8 contracts simultaneously — Put and Call
- Lines run from your open date to 4:00 PM ET on expiration day
- Puts in red, Calls in blue (colors and opacity customizable)
- Compact label at the end of each line: 610 P May 1
- Labels can be toggled on/off
- Calendar pickers for both Open date and Expiration date
- Auto-enable — a contract activates as soon as you enter a Strike value; set Strike to 0 to disable it
- Ticker filter — set a symbol (e.g. META) so lines only appear on that specific chart, useful when switching between
tickers
- Works on any symbol and any timeframe
How to use
1. Add the indicator to your chart
2. Open Settings → Inputs
3. For each contract: enter a Strike, select Type (Put/Call), pick Open date and Exp date
4. The line appears automatically — no need to toggle anything
5. Optionally set the Ticker field to lock this instance to a specific symbol
Tips
- Leave Ticker blank → lines show on every chart
- Open date defaults to today — change it only if you entered the position on a previous day
- To remove a contract, set its Strike back to 0
- Use contracts 5–8 for additional positions
- Adjust colors and line width in the Style group
オープンソーススクリプト
TradingViewの精神に則り、このスクリプトの作者はコードをオープンソースとして公開してくれました。トレーダーが内容を確認・検証できるようにという配慮です。作者に拍手を送りましょう!無料で利用できますが、コードの再公開はハウスルールに従う必要があります。

免責事項
これらの情報および投稿は、TradingViewが提供または承認する金融、投資、取引、またはその他の種類の助言もしくは推奨であることを意図したものではなく、またこれらに該当するものでもありません。詳細は利用規約をご覧ください。
オープンソーススクリプト
TradingViewの精神に則り、このスクリプトの作者はコードをオープンソースとして公開してくれました。トレーダーが内容を確認・検証できるようにという配慮です。作者に拍手を送りましょう!無料で利用できますが、コードの再公開はハウスルールに従う必要があります。
免責事項
これらの情報および投稿は、TradingViewが提供または承認する金融、投資、取引、またはその他の種類の助言もしくは推奨であることを意図したものではなく、またこれらに該当するものでもありません。詳細は利用規約をご覧ください。