Celestial Events Pro Enhanced [R2D2]
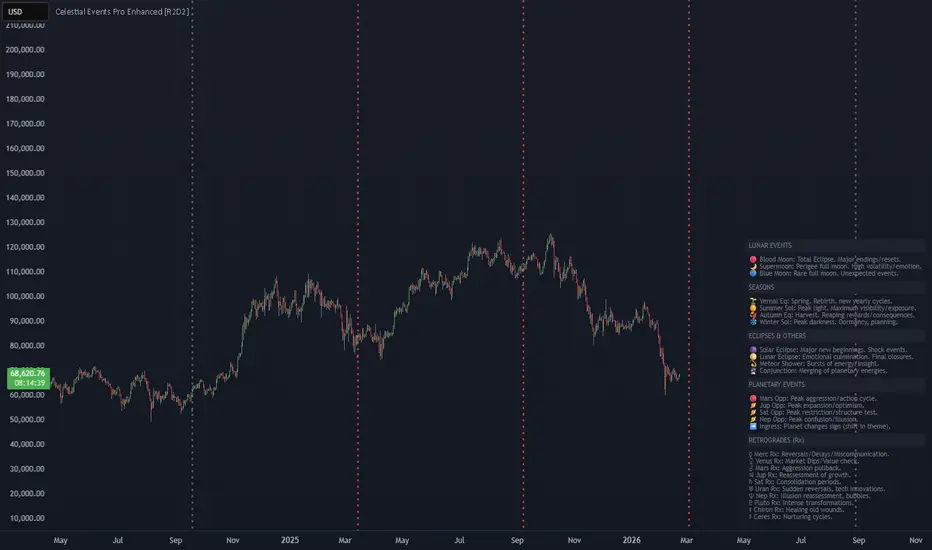
🌌 Celestial Events Pro Enhanced: The Quant-Astro Edge
Theory: Why Trade the Stars?
Financial Astrology is not about "magic"; it is about cyclical timing and collective human psychology. Markets are driven by participants whose emotions—fear, greed, optimism, and caution—historically oscillate in alignment with celestial rhythms.
Professional "Astro-Traders" treat these events as Time-Cycle Filters. Just as a RSI tells you what price is doing, celestial signals suggest when the underlying sentiment is most likely to shift. By overlaying these events on your technical charts, you are identifying high-probability "windows of change" where technical patterns (like a breakout) are more likely to succeed or fail.
🛡️ The Probability Framework
It is critical to view these signals as probabilities, not certainties.
Outer Planets (Pluto, Neptune, Uranus): Influence long-term, generational economic shifts.
Inner Planets (Mercury, Venus, Mars): Drive short-term volatility and "noise".
Success Rate: Studies on specific cycles, such as the Moon, show that while they don't always "beat" the market, they often significantly reduce maximum drawdown when used as an exit/entry filter.
🌓 Event Guide for Professional Trading
1. Lunar Cycles: The Sentiment Pulse
🌑 New Moon: Often associated with "fresh energy" and the start of new trends or reversals.
🌕 Full Moon: Correlates with heightened emotions and volatility. Statistically a common point for trend exhaustion or short-term pivots.
🔴 Blood Moons (Total Eclipses): High-impact catalysts. They act as "blind spots" where sudden, unexpected information hits the market, leading to major trend resets.
🌙 Supermoons: Occur when the moon is closest to Earth; these often amplify the volatility expected during a standard Full Moon.
2. Retrogrades (Rx): The Reversal Zones
Retrogrades are periods where a planet appears to move backward. In trading, this signals re-evaluation.
☿ Mercury Rx: The "Chaos King." Expect false breakouts, communication errors in news feeds, and choppy price action. Trend reversals are common in the first half of the period.
♀ Venus Rx: Directly impacts Value. Correlates with market corrections, re-pricing of assets, and shifts in "risk-on" appetite.
♂ Mars Rx: A drain on momentum. Aggressive trends often stall or enter slow, grinding corrections.
3. Planetary Oppositions & Ingress: The Structural Shifts
🪐 Oppositions (180°): Represent a "tug-of-war" between two energies. These are powerful indicators of major trend reversals and peak exhaustion in the markets.
➡️ Ingress (Sign Changes): When a slow-moving planet (like Pluto or Jupiter) enters a new zodiac sign, the "theme" of the market shifts. For example, Jupiter (Expansion) moving into a new sign can signal which sectors will lead the next rally.
4. Seasons & Eclipses: The Macro Markers
🌱 Equinoxes & Solstices: Historically used as "natural resets." These markers often coincide with quarterly earnings cycles and major institutional rebalancing.
🌑 Solar Eclipses: These are "Shock Events." They often mark significant, long-term highs or lows in major indices that aren't realized until weeks later.
🚀 How to Use This Script
Confluence is King: Never take a trade based on a celestial event alone. Look for a Celestial Line to appear at the same time price hits a Technical Support/Resistance level.
The Outlook Table: Use the built-in Outlook Table to prepare for upcoming volatility. If a "Blood Moon" and "Mercury Rx" are approaching, consider tightening your stop-losses.
Future Forecasting: The script projects lines into the future. Use these as "Time Targets." If you are in a long trade and see a "Saturn Opposition" line ahead, that is your target date to look for exit signals.
Theory: Why Trade the Stars?
Financial Astrology is not about "magic"; it is about cyclical timing and collective human psychology. Markets are driven by participants whose emotions—fear, greed, optimism, and caution—historically oscillate in alignment with celestial rhythms.
Professional "Astro-Traders" treat these events as Time-Cycle Filters. Just as a RSI tells you what price is doing, celestial signals suggest when the underlying sentiment is most likely to shift. By overlaying these events on your technical charts, you are identifying high-probability "windows of change" where technical patterns (like a breakout) are more likely to succeed or fail.
🛡️ The Probability Framework
It is critical to view these signals as probabilities, not certainties.
Outer Planets (Pluto, Neptune, Uranus): Influence long-term, generational economic shifts.
Inner Planets (Mercury, Venus, Mars): Drive short-term volatility and "noise".
Success Rate: Studies on specific cycles, such as the Moon, show that while they don't always "beat" the market, they often significantly reduce maximum drawdown when used as an exit/entry filter.
🌓 Event Guide for Professional Trading
1. Lunar Cycles: The Sentiment Pulse
🌑 New Moon: Often associated with "fresh energy" and the start of new trends or reversals.
🌕 Full Moon: Correlates with heightened emotions and volatility. Statistically a common point for trend exhaustion or short-term pivots.
🔴 Blood Moons (Total Eclipses): High-impact catalysts. They act as "blind spots" where sudden, unexpected information hits the market, leading to major trend resets.
🌙 Supermoons: Occur when the moon is closest to Earth; these often amplify the volatility expected during a standard Full Moon.
2. Retrogrades (Rx): The Reversal Zones
Retrogrades are periods where a planet appears to move backward. In trading, this signals re-evaluation.
☿ Mercury Rx: The "Chaos King." Expect false breakouts, communication errors in news feeds, and choppy price action. Trend reversals are common in the first half of the period.
♀ Venus Rx: Directly impacts Value. Correlates with market corrections, re-pricing of assets, and shifts in "risk-on" appetite.
♂ Mars Rx: A drain on momentum. Aggressive trends often stall or enter slow, grinding corrections.
3. Planetary Oppositions & Ingress: The Structural Shifts
🪐 Oppositions (180°): Represent a "tug-of-war" between two energies. These are powerful indicators of major trend reversals and peak exhaustion in the markets.
➡️ Ingress (Sign Changes): When a slow-moving planet (like Pluto or Jupiter) enters a new zodiac sign, the "theme" of the market shifts. For example, Jupiter (Expansion) moving into a new sign can signal which sectors will lead the next rally.
4. Seasons & Eclipses: The Macro Markers
🌱 Equinoxes & Solstices: Historically used as "natural resets." These markers often coincide with quarterly earnings cycles and major institutional rebalancing.
🌑 Solar Eclipses: These are "Shock Events." They often mark significant, long-term highs or lows in major indices that aren't realized until weeks later.
🚀 How to Use This Script
Confluence is King: Never take a trade based on a celestial event alone. Look for a Celestial Line to appear at the same time price hits a Technical Support/Resistance level.
The Outlook Table: Use the built-in Outlook Table to prepare for upcoming volatility. If a "Blood Moon" and "Mercury Rx" are approaching, consider tightening your stop-losses.
Future Forecasting: The script projects lines into the future. Use these as "Time Targets." If you are in a long trade and see a "Saturn Opposition" line ahead, that is your target date to look for exit signals.

免責事項
これらの情報および投稿は、TradingViewが提供または承認する金融、投資、取引、またはその他の種類の助言もしくは推奨であることを意図したものではなく、またこれらに該当するものでもありません。詳細は利用規約をご覧ください。
免責事項
これらの情報および投稿は、TradingViewが提供または承認する金融、投資、取引、またはその他の種類の助言もしくは推奨であることを意図したものではなく、またこれらに該当するものでもありません。詳細は利用規約をご覧ください。