OPEN-SOURCE SCRIPT
更新済 SametCond Optimizer Heatmap [RSI]
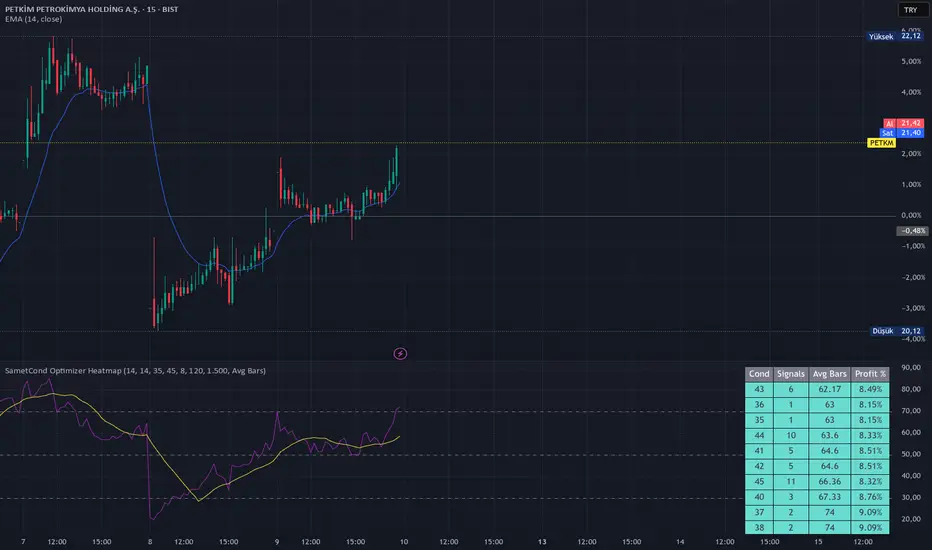
SametCond Optimizer Heatmap is a research-focused indicator built to compare multiple SametCond threshold values on the same chart and rank their historical behavior in a compact heatmap-style table.
The script uses the following base signal logic:
After each valid signal, the indicator checks whether price reaches a user-defined target percentage within a maximum number of bars. It then aggregates the results for every SametCond level within the selected range and displays the outcomes in a ranked table.
The table shows:
This tool is intended for parameter research and comparative analysis.
Instead of testing only one SametCond threshold at a time, it helps you evaluate a full threshold range and quickly see which values performed better under the current symbol and timeframe.
How to read the table
Each row represents one SametCond threshold.
The table helps answer questions such as:
Inputs
Notes
This is an analysis and optimization tool, not a complete trading strategy.
The script focuses on signals that successfully reach the defined target within the selected look-ahead window. Because of that, results should be interpreted as comparative research output rather than standalone trading advice.
Performance can vary significantly depending on symbol, timeframe, and market conditions. Use it to narrow down candidate parameter zones, then confirm those findings with your own validation and risk management process.
The script uses the following base signal logic:
- RSI crosses above its RSI moving average
- Daily RSI is below 45
- Optional filter: RSI slope must be positive
After each valid signal, the indicator checks whether price reaches a user-defined target percentage within a maximum number of bars. It then aggregates the results for every SametCond level within the selected range and displays the outcomes in a ranked table.
The table shows:
- signal count
- average bars needed to reach the target
- average profit percentage
- ranking by either speed or profit
- What this indicator is for
This tool is intended for parameter research and comparative analysis.
Instead of testing only one SametCond threshold at a time, it helps you evaluate a full threshold range and quickly see which values performed better under the current symbol and timeframe.
How to read the table
Each row represents one SametCond threshold.
The table helps answer questions such as:
- Which threshold reaches the target faster on average?
- Which threshold produces higher average profit?
- Which setting generates enough signals to be worth further testing?
Inputs
- RSI Length: RSI calculation period
- RSI MA Length: moving average length applied to RSI
- SametCond Min / Max: threshold range to evaluate
- Target %: target move measured after each signal
- Require RSI Slope > 0: optional momentum confirmation
- Max Bars To Target: maximum look-ahead window
- Max Signal History: maximum stored signal count
- Sort By: sort results by average bars or profit %
Notes
This is an analysis and optimization tool, not a complete trading strategy.
The script focuses on signals that successfully reach the defined target within the selected look-ahead window. Because of that, results should be interpreted as comparative research output rather than standalone trading advice.
Performance can vary significantly depending on symbol, timeframe, and market conditions. Use it to narrow down candidate parameter zones, then confirm those findings with your own validation and risk management process.
リリースノート
SametCond Optimizer Heatmap is a research-focused indicator built to compare multiple SametCond threshold values on the same chart and rank their historical behavior in a compact heatmap-style table.
The script uses the following base signal logic:
RSI crosses above its RSI moving average
Daily RSI is below 45
Optional filter: RSI slope must be positive
After each valid signal, the indicator checks whether price reaches a user-defined target percentage within a maximum number of bars. It then aggregates the results for every SametCond level within the selected range and displays the outcomes in a ranked table.
The table shows:
signal count
average bars needed to reach the target
average profit percentage
ranking by either speed or profit
What this indicator is for
This tool is intended for parameter research and comparative analysis.
Instead of testing only one SametCond threshold at a time, it helps you evaluate a full threshold range and quickly see which values performed better under the current symbol and timeframe.
How to read the table
Each row represents one SametCond threshold.
The table helps answer questions such as:
Which threshold reaches the target faster on average?
Which threshold produces higher average profit?
Which setting generates enough signals to be worth further testing?
Inputs
RSI Length: RSI calculation period
RSI MA Length: moving average length applied to RSI
SametCond Min / Max: threshold range to evaluate
Target %: target move measured after each signal
Require RSI Slope > 0: optional momentum confirmation
Max Bars To Target: maximum look-ahead window
Max Signal History: maximum stored signal count
Sort By: sort results by average bars or profit %
Notes
This is an analysis and optimization tool, not a complete trading strategy.
The script focuses on signals that successfully reach the defined target within the selected look-ahead window. Because of that, results should be interpreted as comparative research output rather than standalone trading advice.
Performance can vary significantly depending on symbol, timeframe, and market conditions. Use it to narrow down candidate parameter zones, then confirm those findings with your own validation and risk management process.
オープンソーススクリプト
TradingViewの精神に則り、このスクリプトの作者はコードをオープンソースとして公開してくれました。トレーダーが内容を確認・検証できるようにという配慮です。作者に拍手を送りましょう!無料で利用できますが、コードの再公開はハウスルールに従う必要があります。

免責事項
これらの情報および投稿は、TradingViewが提供または承認する金融、投資、取引、またはその他の種類の助言もしくは推奨であることを意図したものではなく、またこれらに該当するものでもありません。詳細は利用規約をご覧ください。
オープンソーススクリプト
TradingViewの精神に則り、このスクリプトの作者はコードをオープンソースとして公開してくれました。トレーダーが内容を確認・検証できるようにという配慮です。作者に拍手を送りましょう!無料で利用できますが、コードの再公開はハウスルールに従う必要があります。
免責事項
これらの情報および投稿は、TradingViewが提供または承認する金融、投資、取引、またはその他の種類の助言もしくは推奨であることを意図したものではなく、またこれらに該当するものでもありません。詳細は利用規約をご覧ください。