OPEN-SOURCE SCRIPT
Reaction Based Support and Resistance Zones
## Overview
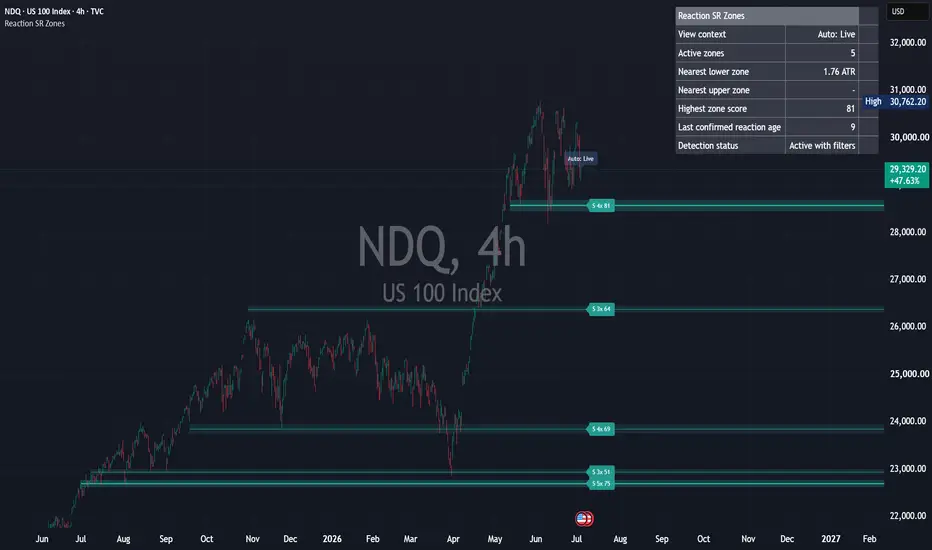
Reaction Based Support and Resistance Zones is a visual price-action study tool for reaction-based horizontal zones and local reaction levels.
The script is designed to show where price has recently reacted, how those reactions are grouped into zones, and how the same reaction context can be studied both in the current live chart and in historical visible-range views.
It does not generate trading signals. It does not provide entries, exits, targets, stops, position sizing, win rate, or performance claims.
## What it shows
This script can display:
- Live reaction zones based on confirmed pivot reactions.
- Support-like, resistance-like, mixed, and inactive reaction roles.
- Touch count, freshness, ATR-normalized reaction strength, width penalty, and a visual zone score.
- Visible Range Research context for historical chart study.
- Local Window Levels across the visible historical window.
- A compact dashboard with neutral context information.
- Neutral live alerts for confirmed reaction-zone events.
The displayed zones and local levels are historical reaction context. They are not predictions.
## Context modes
The script includes three context modes:
### Live
Live context shows the current reaction-zone state at the latest bars. This is the normal current-chart view. Live context can extend active zones to the right for readability.
Live is the only context that can trigger alerts.
### Visible Range Research
Visible Range Research reconstructs the reaction context as it existed at the right edge of the currently visible chart range.
This mode is intended for historical visual study. When the user scrolls or zooms the chart, the research view recalculates for that visible range.
Visible Range Research does not trigger alerts.
### Auto Hybrid
Auto Hybrid is the default mode.
When the latest bars are visible, the script uses Live context. When the chart is scrolled back into historical data, the script switches to Visible Range Research.
## How it works
The script uses confirmed pivot highs and confirmed pivot lows as reaction events.
A support-like reaction is based on a confirmed pivot low. A resistance-like reaction is based on a confirmed pivot high.
Nearby reactions are clustered into reaction zones. Each zone stores information such as:
- center price
- zone width
- first and last reaction
- touch count
- support-like and resistance-like reaction counts
- average and maximum reaction strength
- invalidation state
- visual quality information
Zones are scored using a configurable combination of touch count, freshness, ATR-normalized reaction strength, width penalty, quality information, and invalidation state.
Only confirmed pivots are used. Unconfirmed pivot points are not displayed.
## Local Window Levels
Visible Range Research includes a local-window layer built directly from confirmed pivot reactions.
Local Window Levels are independent from the right-edge context zones. This means smaller reactions on the left, center, or right side of the visible historical chart can remain visible even if they later become part of a broader context zone.
Local Window Levels can:
- appear on the left, center, or right side of the visible chart
- start and end inside the visible window
- continue from the visible left edge if they already existed at that point
- end before the visible right edge
- show smaller historical reaction areas that may not be obvious from broader zones alone
This behavior is intentional. The local layer is for historical visual study, not for prediction.
## Local detection quality
The local layer includes quality controls for confirmed pivot reactions.
Balanced Quality is the default profile. It is designed to reduce obvious noise while still keeping useful local reaction context visible.
Exploratory shows more local reactions for broader visual study.
Strict and Very Strict reduce the number of local levels by requiring stronger reaction quality.
Local reaction quality can consider:
- ATR-normalized reaction distance
- wick or close-away validation
- local pivot prominence
- same-swing duplicate suppression
- short-term local clustering
Line density is controlled before a local level is confirmed. Confirmed local levels are not hidden merely for visual clarity in the rendering stage unless a hard object limit or explicit user setting applies.
## Historical visual study
In Visible Range Research, local levels are drawn relative to the currently visible chart window.
A local level does not need to extend to the visible right edge.
Short lines, mid-window lines, and lines that end before the right side of the chart are normal. They show where local reaction areas existed during that historical view.
This mode helps users study how reaction areas formed, continued, changed, or stopped being relevant across past market structure.
## Dashboard
The dashboard provides compact context information, including:
- current view context
- active zone count
- nearest lower reaction zone
- nearest upper reaction zone
- highest zone score
- last confirmed reaction age
- detection status
The dashboard uses neutral wording. It does not recommend any trading action.
Dashboard text size, backdrop strength, position, and right-side spacing are adjustable for readability near the price scale.
## Alerts
Alerts are live-context event notifications only.
Available alert events include:
- New reaction zone confirmed
- Existing reaction zone updated
- Price touched an active reaction zone
- Reaction zone became inactive
- Reaction zone reactivated after a confirmed reaction
Visible Range Research rendering does not trigger alerts.
## How to use it
Use this script as a visual context tool for price areas where confirmed historical reactions have occurred.
Possible study uses include:
- observing recent reaction zones in Live context
- reviewing how reaction areas formed in past visible chart windows
- comparing broader reaction zones with smaller Local Window Levels
- adjusting detection quality profiles to fit the symbol and timeframe
- keeping the chart clean while still preserving reaction context
The default settings are starting points, not optimized settings.
## Limitations
Reaction zones and local levels are historical context, not forecasts.
A reaction area can stop reacting at any time.
Pivot-based events appear only after confirmation, so there is a natural confirmation delay.
Visible Range Research recalculates when the chart is scrolled or zoomed.
Lower timeframes and highly volatile symbols can produce more local levels.
Strict settings may remove useful reactions. Exploratory settings may show more lines.
This is a visual study tool, not a strategy or backtest engine.
## Non-repaint explanation
The script uses confirmed pivot highs and confirmed pivot lows only.
A pivot reaction is processed only after the required pivot-right confirmation bars have passed.
Unconfirmed pivots are not displayed.
The script does not use request.security() with lookahead.
Visible Range Research reconstructs the reaction context using only the information available up to the visible right edge.
Scores and visual states can update as new confirmed bars become available, but this is based on confirmed historical data and does not use future data relative to the active context.
## What this script does not do
This script does not generate trading signals.
It does not provide entries, exits, targets, stops, position sizing, win rate, or performance claims.
It does not predict future price movement.
It does not simulate orders.
It is not a strategy.
It is not a backtest system.
It is not financial advice.
## 日本語補足
このインジケーターは、価格が実際に反応した水平帯を可視化するための研究用ツールです。
Liveでは最新状態の主要な反応ゾーンを表示します。
Visible Range Researchでは、過去にスクロールした表示範囲の右端時点を基準に、当時存在していた反応コンテキストを再構築します。
Local Window Levelsは、表示範囲内の確定pivot反応から作られる局所的な反応ラインです。左側、中央、右側に出る短い線や、右端まで伸びない線は仕様です。過去相場の中で、どこに細かい反応帯が存在したかを研究するためのものです。
ライン数は、描画側で検知済みのものを隠して減らすのではなく、検知品質やローカルクラスタリングによって調整します。
このスクリプトは売買シグナルではありません。エントリー、エグジット、利確、損切り、ポジションサイズ、勝率、収益性、将来予測を提供しません。投資助言ではありません。
Reaction Based Support and Resistance Zones is a visual price-action study tool for reaction-based horizontal zones and local reaction levels.
The script is designed to show where price has recently reacted, how those reactions are grouped into zones, and how the same reaction context can be studied both in the current live chart and in historical visible-range views.
It does not generate trading signals. It does not provide entries, exits, targets, stops, position sizing, win rate, or performance claims.
## What it shows
This script can display:
- Live reaction zones based on confirmed pivot reactions.
- Support-like, resistance-like, mixed, and inactive reaction roles.
- Touch count, freshness, ATR-normalized reaction strength, width penalty, and a visual zone score.
- Visible Range Research context for historical chart study.
- Local Window Levels across the visible historical window.
- A compact dashboard with neutral context information.
- Neutral live alerts for confirmed reaction-zone events.
The displayed zones and local levels are historical reaction context. They are not predictions.
## Context modes
The script includes three context modes:
### Live
Live context shows the current reaction-zone state at the latest bars. This is the normal current-chart view. Live context can extend active zones to the right for readability.
Live is the only context that can trigger alerts.
### Visible Range Research
Visible Range Research reconstructs the reaction context as it existed at the right edge of the currently visible chart range.
This mode is intended for historical visual study. When the user scrolls or zooms the chart, the research view recalculates for that visible range.
Visible Range Research does not trigger alerts.
### Auto Hybrid
Auto Hybrid is the default mode.
When the latest bars are visible, the script uses Live context. When the chart is scrolled back into historical data, the script switches to Visible Range Research.
## How it works
The script uses confirmed pivot highs and confirmed pivot lows as reaction events.
A support-like reaction is based on a confirmed pivot low. A resistance-like reaction is based on a confirmed pivot high.
Nearby reactions are clustered into reaction zones. Each zone stores information such as:
- center price
- zone width
- first and last reaction
- touch count
- support-like and resistance-like reaction counts
- average and maximum reaction strength
- invalidation state
- visual quality information
Zones are scored using a configurable combination of touch count, freshness, ATR-normalized reaction strength, width penalty, quality information, and invalidation state.
Only confirmed pivots are used. Unconfirmed pivot points are not displayed.
## Local Window Levels
Visible Range Research includes a local-window layer built directly from confirmed pivot reactions.
Local Window Levels are independent from the right-edge context zones. This means smaller reactions on the left, center, or right side of the visible historical chart can remain visible even if they later become part of a broader context zone.
Local Window Levels can:
- appear on the left, center, or right side of the visible chart
- start and end inside the visible window
- continue from the visible left edge if they already existed at that point
- end before the visible right edge
- show smaller historical reaction areas that may not be obvious from broader zones alone
This behavior is intentional. The local layer is for historical visual study, not for prediction.
## Local detection quality
The local layer includes quality controls for confirmed pivot reactions.
Balanced Quality is the default profile. It is designed to reduce obvious noise while still keeping useful local reaction context visible.
Exploratory shows more local reactions for broader visual study.
Strict and Very Strict reduce the number of local levels by requiring stronger reaction quality.
Local reaction quality can consider:
- ATR-normalized reaction distance
- wick or close-away validation
- local pivot prominence
- same-swing duplicate suppression
- short-term local clustering
Line density is controlled before a local level is confirmed. Confirmed local levels are not hidden merely for visual clarity in the rendering stage unless a hard object limit or explicit user setting applies.
## Historical visual study
In Visible Range Research, local levels are drawn relative to the currently visible chart window.
A local level does not need to extend to the visible right edge.
Short lines, mid-window lines, and lines that end before the right side of the chart are normal. They show where local reaction areas existed during that historical view.
This mode helps users study how reaction areas formed, continued, changed, or stopped being relevant across past market structure.
## Dashboard
The dashboard provides compact context information, including:
- current view context
- active zone count
- nearest lower reaction zone
- nearest upper reaction zone
- highest zone score
- last confirmed reaction age
- detection status
The dashboard uses neutral wording. It does not recommend any trading action.
Dashboard text size, backdrop strength, position, and right-side spacing are adjustable for readability near the price scale.
## Alerts
Alerts are live-context event notifications only.
Available alert events include:
- New reaction zone confirmed
- Existing reaction zone updated
- Price touched an active reaction zone
- Reaction zone became inactive
- Reaction zone reactivated after a confirmed reaction
Visible Range Research rendering does not trigger alerts.
## How to use it
Use this script as a visual context tool for price areas where confirmed historical reactions have occurred.
Possible study uses include:
- observing recent reaction zones in Live context
- reviewing how reaction areas formed in past visible chart windows
- comparing broader reaction zones with smaller Local Window Levels
- adjusting detection quality profiles to fit the symbol and timeframe
- keeping the chart clean while still preserving reaction context
The default settings are starting points, not optimized settings.
## Limitations
Reaction zones and local levels are historical context, not forecasts.
A reaction area can stop reacting at any time.
Pivot-based events appear only after confirmation, so there is a natural confirmation delay.
Visible Range Research recalculates when the chart is scrolled or zoomed.
Lower timeframes and highly volatile symbols can produce more local levels.
Strict settings may remove useful reactions. Exploratory settings may show more lines.
This is a visual study tool, not a strategy or backtest engine.
## Non-repaint explanation
The script uses confirmed pivot highs and confirmed pivot lows only.
A pivot reaction is processed only after the required pivot-right confirmation bars have passed.
Unconfirmed pivots are not displayed.
The script does not use request.security() with lookahead.
Visible Range Research reconstructs the reaction context using only the information available up to the visible right edge.
Scores and visual states can update as new confirmed bars become available, but this is based on confirmed historical data and does not use future data relative to the active context.
## What this script does not do
This script does not generate trading signals.
It does not provide entries, exits, targets, stops, position sizing, win rate, or performance claims.
It does not predict future price movement.
It does not simulate orders.
It is not a strategy.
It is not a backtest system.
It is not financial advice.
## 日本語補足
このインジケーターは、価格が実際に反応した水平帯を可視化するための研究用ツールです。
Liveでは最新状態の主要な反応ゾーンを表示します。
Visible Range Researchでは、過去にスクロールした表示範囲の右端時点を基準に、当時存在していた反応コンテキストを再構築します。
Local Window Levelsは、表示範囲内の確定pivot反応から作られる局所的な反応ラインです。左側、中央、右側に出る短い線や、右端まで伸びない線は仕様です。過去相場の中で、どこに細かい反応帯が存在したかを研究するためのものです。
ライン数は、描画側で検知済みのものを隠して減らすのではなく、検知品質やローカルクラスタリングによって調整します。
このスクリプトは売買シグナルではありません。エントリー、エグジット、利確、損切り、ポジションサイズ、勝率、収益性、将来予測を提供しません。投資助言ではありません。
オープンソーススクリプト
TradingViewの精神に則り、このスクリプトの作者はコードをオープンソースとして公開してくれました。トレーダーが内容を確認・検証できるようにという配慮です。作者に拍手を送りましょう!無料で利用できますが、コードの再公開はハウスルールに従う必要があります。

免責事項
これらの情報および投稿は、TradingViewが提供または承認する金融、投資、取引、またはその他の種類の助言もしくは推奨であることを意図したものではなく、またこれらに該当するものでもありません。詳細は利用規約をご覧ください。
オープンソーススクリプト
TradingViewの精神に則り、このスクリプトの作者はコードをオープンソースとして公開してくれました。トレーダーが内容を確認・検証できるようにという配慮です。作者に拍手を送りましょう!無料で利用できますが、コードの再公開はハウスルールに従う必要があります。
免責事項
これらの情報および投稿は、TradingViewが提供または承認する金融、投資、取引、またはその他の種類の助言もしくは推奨であることを意図したものではなく、またこれらに該当するものでもありません。詳細は利用規約をご覧ください。