アップデート済
PHOENIX Open Reversal v0.9
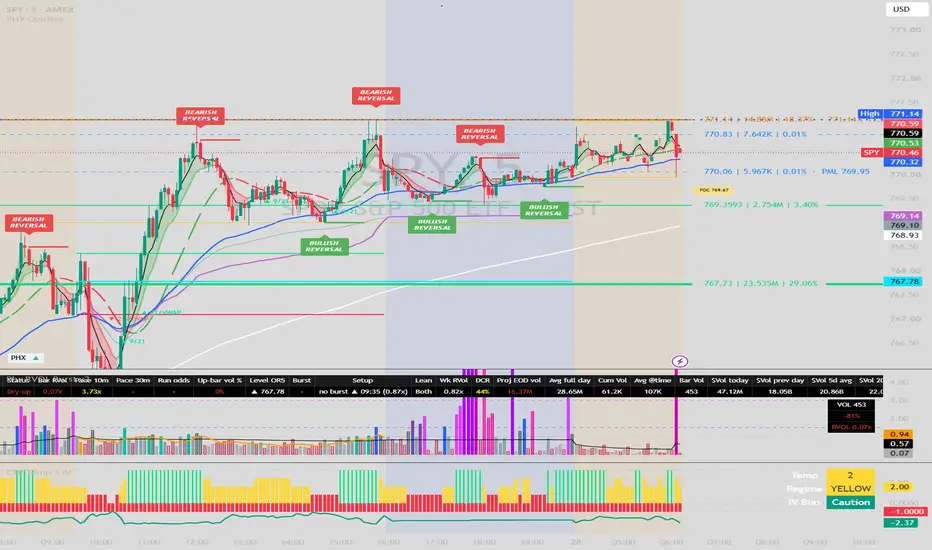
WHAT IT DOES
PHOENIX Open Reversal is an intraday tool for the first hour of the US cash session. It draws the levels that matter at the open, watches for a sweep of one of those levels that closes back inside (a "reclaim"), and only calls a setup CONFIRMED when that reclaim and a fast/slow moving-average cross agree with each other within a few bars. Each confirmed setup is then tracked on the chart with its stop, its 1R and 2R lines, and the bar where it stopped out, reached a target, or exited. A small table keeps a running score of every signal type against a coin-toss baseline computed on the same chart, so you can see for yourself whether a signal type is doing better than chance on the symbol and timeframe you are looking at.
It is built for 2, 3, 5, 15 and 30 minute charts of US stocks and ETFs. The chart needs extended hours turned ON, otherwise there are no pre-market bars and the pre-market high and low cannot be found.
HOW IT WORKS
1. Levels
Every regular session the script draws, as line objects with one shared set of width, style and ray/segment inputs:
- PMH and PML: the pre-market high and low (04:00 to 09:29 New York, adjustable).
- ONH and ONL: the overnight high and low (prior close to the open).
- PDH, PDL and PDC: the prior day's high, low and close, requested from the daily timeframe with a one-bar offset so they do not repaint.
- VWAP anchored at 09:30 (or at 04:00).
- The opening candle box (OCH / OCL) with optional ATR bands above and below it, or an opening range box of 5, 15, 30 or 60 minutes. One box at a time, by a selector. The box extends for a chosen multiple of its own length (default 3, so a 5 minute box ends at 15 minutes) and then stops.
Labels at the right edge name each level and its price. Levels that sit within a chosen fraction of ATR of each other share one label so they do not pile up.
2. WATCH
A fast and a slow moving average (defaults 5 and 9, EMA, both adjustable) are plotted with a cloud between them. When the fast crosses the slow, a WATCH is raised and a small yellow box at the top of the chart says which way the cross went and whether price was ABOVE or BELOW VWAP at the time. A WATCH does nothing by itself. Optional gates can require a minimum relative volume, the same side of the prior close, or an index filter (SPY and QQQ above or below their daily EMA); these are off by default. If a cross does not become a WATCH, a small grey dot is printed and its tooltip names the rule that blocked it.
3. Identifiers
A candle identifier is a bar that says something about reversal. The script computes several and you choose which may confirm a setup:
- RECLAIM (default on): the bar trades through one of the levels above by at least a chosen fraction of ATR and closes back on the original side. One per level per side per session.
- PMH / PML breakout (default on): a close above the pre-market high (or below the low) on the first break or within a short window after it, with relative volume above a threshold, price beyond the prior day's high/low and close, a limited rejection wick, and an optional SPY/QQQ filter. This part follows the opening-drive breakout model taught by SMB Capital, implemented here from scratch; its stop is the alert candle's low or high.
- Two-candle reversal: two consecutive small-body or hammer-type candles followed by a larger candle closing beyond their range.
- Manipulation candle: a bar that takes out the previous bar's low and closes above its high, or the mirror.
- Engulfing on volume: a body that engulfs the previous body with relative volume above a threshold.
- Doji-range break: a close through the range of a small-body candle.
The last four are available but off by default as confirmation sources, for the reason given under "Limitations".
4. CONFIRM
A setup is CONFIRMED when an enabled identifier and a same-direction moving-average cross happen within N bars of each other, in either order (default 6 bars), after the first 15 minutes of the session and inside the signal window (default 60 minutes). Both the 15 minutes and the window are inputs. The top box turns green for a long or red for a short, names the identifier and the cross, and clears a chosen number of minutes later (default 5). Only one setup per direction is active at a time.
5. Trade tracking
Each CONFIRMED setup records its entry (the confirming bar's close) and its stop (the identifier candle's extreme). The script draws the stop as a dashed line and 1R and 2R as dotted lines, extends them bar by bar, and prints STOPPED when the stop is touched, 1R and 2R when those are reached, and EXIT with the R multiple when the trade ends. The exit rule is an input: the first close through the slow moving average (default), or stop-or-2R only. After a stop or an exit, a new setup in that direction may confirm again.
6. Scoring table
The table (position and size adjustable) lists each signal type with two scores: the share of signals that gained half an ATR before losing half an ATR within a chosen number of bars, and the share that reached 1R before the stop. The bottom row, BASELINE, applies the same two tests to every bar on the chart in both directions, which is what random entry scores on that symbol and timeframe. A signal type is coloured green when it is more than five points above BASELINE and red when more than five below, and amber while fewer than 30 instances have been scored. A status row shows the session state, relative volume, VWAP side, the index filter state and the moving-average state.
7. Alerts
Alert conditions exist for WATCH, CONFIRMED long, CONFIRMED short, the pre-market breakout, the reclaim signals, the two-candle setup and confirmation, the manipulation candle, closes through the opening candle high or low, trade STOPPED, trade 1R/2R, and trade EXIT. Secondary events (doji-range breaks, engulfing bars, breakout stop hits) fire through alert() calls, so set an alert on "Any alert() function call" to receive them.
WHY THIS COMBINATION
Level sweeps, moving-average crosses and candle patterns are each common on their own. The reason they are combined here is that a reclaim alone fires on most opening candles, because the first bar of the day crosses a pre-market level more often than not, and a cross alone is late. Requiring the two to agree within a few bars, and ignoring the first minutes of the session, is the specific idea this script implements, and the scoring table is there so that the user can check that idea on their own symbols instead of taking it on faith. The trade-tracking lines and the EXIT rule turn a signal into something that can be measured in R rather than a mark on a chart.
HOW TO USE IT
- Turn on extended hours. Use a 2 to 30 minute chart.
- Leave the defaults for a few sessions and read the table. Amber scores mean too few instances to say anything.
- A yellow WATCH box is information, not a signal. Act only on a green or red CONFIRMED box, and only with the drawn stop in view.
- If you trade one direction only, turn the other off in the identifier settings.
- The window, the ignored minutes, the lag between identifier and cross, the relative-volume gates and the exit rule are all inputs. Change them one at a time and watch what the table does.
LIMITATIONS AND HONEST NOTES
- Signals are evaluated on confirmed bars. On the real-time bar the moving averages, VWAP and relative volume change until the bar closes, so a WATCH or CONFIRM can only appear once the bar has closed. Level labels at the right edge are repositioned on the last bar; the lines themselves do not move.
- The daily values are requested with a one-bar offset and are therefore not subject to lookahead. The index filter uses the prior day's EMA for the same reason.
- The scoring table measures hypothetical outcomes with a fixed rule on past bars of the loaded chart. It is not a trade log, it includes no costs or slippage, and it says nothing about the future. Fewer than 30 instances is noise.
- The default settings came from replaying the rules on roughly 30 sessions of 5 minute bars for ten large-cap US stocks and ETFs. That sample is small, it is not a backtest with costs, and it is not a performance claim; it is the reason the four extra identifiers are off by default, because in that sample they did not score above the baseline. Your symbols may behave differently, which is exactly why the BASELINE row is on the chart.
- The pre-market high and low require pre-market bars. On symbols or data plans without extended-hours data, PMH and PML will be empty and the pre-market breakout cannot fire.
- Relative volume compares the current bar and cumulative volume with the same clock slot averaged over the previous 20 sessions. It needs some history loaded before it becomes meaningful; until then the volume gates pass or fail on simple averages.
- This is an indicator, not a strategy. It places no orders and does not manage risk for you.
CREDITS
First Credit always-1 Corinthians 13:4-7
- The hammer, inverted hammer and doji geometry used by the two-candle identifier is adapted from the open-source "Reversal Candlestick Structure" by LuxAlgo, published under a Creative Commons Attribution-NonCommercial-ShareAlike 4.0 license. Credit is also given in the source code. The rest of the script, including the level engine, the WATCH/CONFIRM logic, the trade tracking and the scoring table, was written for this publication.
- The pre-market breakout rules follow the opening-drive model taught publicly by SMB Capital; the implementation is original.
- The Gaussian filter line is the classic 4-pole Gaussian filter described by John Ehlers.
1 Cori
リリースノート
Optimize triggers and levels.
免責事項
これらの情報および投稿は、TradingViewが提供または承認する金融、投資、取引、またはその他の種類の助言もしくは推奨であることを意図したものではなく、またこれらに該当するものでもありません。詳細は利用規約をご覧ください。
免責事項
これらの情報および投稿は、TradingViewが提供または承認する金融、投資、取引、またはその他の種類の助言もしくは推奨であることを意図したものではなく、またこれらに該当するものでもありません。詳細は利用規約をご覧ください。