OPEN-SOURCE SCRIPT
Customized Double Bollinger Bands [wjdtks255]
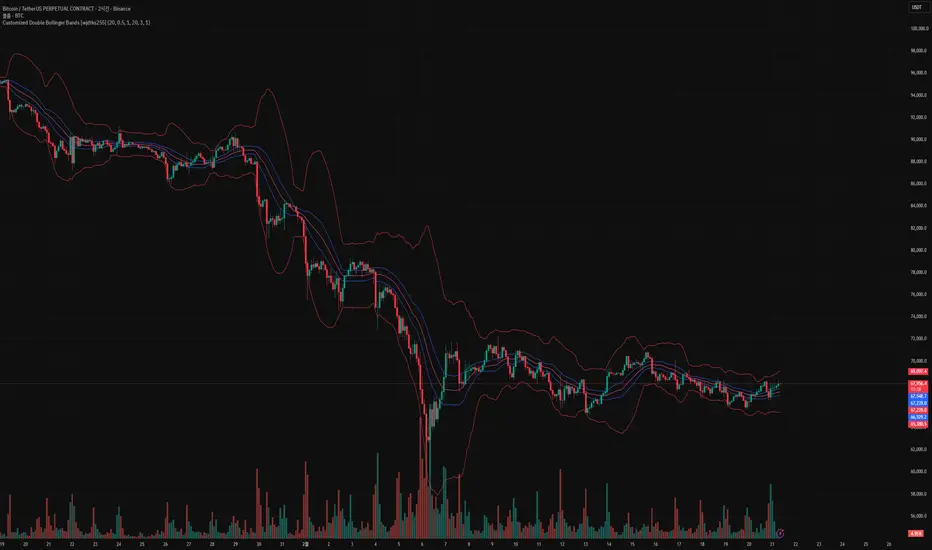
■ Technical Overview
The Customized Double Bollinger Bands is a multi-layered volatility analysis framework. Unlike standard single-band indicators, this script synchronizes two independent volatility engines to identify both the "Value Area" (Band 1) and "Extreme Volatility Zones" (Band 2) simultaneously on a single interface.
■ Implementation & Logic
Dual-Deviation Synchronization: The script calculates two distinct standard deviation layers ($StdDev_{0.5}$ and $StdDev_{3.0}$) to provide a high-fidelity view of price distribution.
Dynamic Range Compression: By comparing the gap between the Blue (Inner) and Red (Outer) bands, traders can visually identify "Squeeze" and "Expansion" phases with institutional-grade precision.
■ Key Features
Fully Customizable Layers: Independent control over 'Length', 'StdDev', and 'Color' for both band sets allows for adaptive strategies across different timeframes.
Optimized Visual Clarity: Designed with specific line-width controls to ensure the chart remains readable even during high-volatility spikes.
■ Trading Method
Core Trend: Use the Inner Blue Bands ($0.5$ StdDev) to track the primary trend strength.
Reversal Watch: Use the Outer Red Bands ($3.0$ StdDev) as exhaustion points where price is statistically overextended.
The Customized Double Bollinger Bands is a multi-layered volatility analysis framework. Unlike standard single-band indicators, this script synchronizes two independent volatility engines to identify both the "Value Area" (Band 1) and "Extreme Volatility Zones" (Band 2) simultaneously on a single interface.
■ Implementation & Logic
Dual-Deviation Synchronization: The script calculates two distinct standard deviation layers ($StdDev_{0.5}$ and $StdDev_{3.0}$) to provide a high-fidelity view of price distribution.
Dynamic Range Compression: By comparing the gap between the Blue (Inner) and Red (Outer) bands, traders can visually identify "Squeeze" and "Expansion" phases with institutional-grade precision.
■ Key Features
Fully Customizable Layers: Independent control over 'Length', 'StdDev', and 'Color' for both band sets allows for adaptive strategies across different timeframes.
Optimized Visual Clarity: Designed with specific line-width controls to ensure the chart remains readable even during high-volatility spikes.
■ Trading Method
Core Trend: Use the Inner Blue Bands ($0.5$ StdDev) to track the primary trend strength.
Reversal Watch: Use the Outer Red Bands ($3.0$ StdDev) as exhaustion points where price is statistically overextended.
オープンソーススクリプト
TradingViewの精神に則り、このスクリプトの作者はコードをオープンソースとして公開してくれました。トレーダーが内容を確認・検証できるようにという配慮です。作者に拍手を送りましょう!無料で利用できますが、コードの再公開はハウスルールに従う必要があります。

免責事項
これらの情報および投稿は、TradingViewが提供または承認する金融、投資、取引、またはその他の種類の助言もしくは推奨であることを意図したものではなく、またこれらに該当するものでもありません。詳細は利用規約をご覧ください。
オープンソーススクリプト
TradingViewの精神に則り、このスクリプトの作者はコードをオープンソースとして公開してくれました。トレーダーが内容を確認・検証できるようにという配慮です。作者に拍手を送りましょう!無料で利用できますが、コードの再公開はハウスルールに従う必要があります。
免責事項
これらの情報および投稿は、TradingViewが提供または承認する金融、投資、取引、またはその他の種類の助言もしくは推奨であることを意図したものではなく、またこれらに該当するものでもありません。詳細は利用規約をご覧ください。