Dynamic Profile Key Levels [AlgoAlpha]
More exclusive indicators from AlgoAlpha
Subscribe to Unfair Advantage Pack for $65.57/month to get exclusive indicators by this author. You pay right on TradingView and can use them on your charts straight away.
Explore Unfair Advantage Pack🟠 OVERVIEW
Volume profiles show where trading activity is concentrated across different price levels. But a standard volume profile often focuses on the current distribution, making it harder to track how important price levels develop, persist, and react over time.
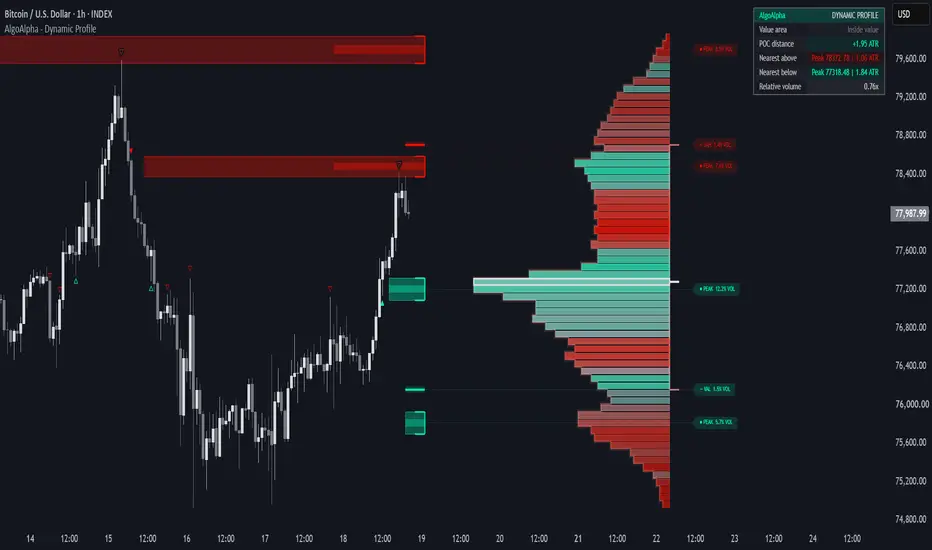
Dynamic Profile Key Levels [AlgoAlpha] combines a volume profile with volume peaks, troughs, ranked volume levels, and value area boundaries. It identifies areas of high and low trading activity and displays them as price levels or zones directly on the chart.
The indicator also tracks historical levels and identifies price breaks, rejections, and retests. This helps traders study how price responds to areas of previous trading activity without relying only on the latest volume distribution.
🟠 CONCEPTS
🟠 FEATURES
🟠 HOW TO USE
🟠 CONCLUSION
Dynamic Profile Key Levels [AlgoAlpha] combines volume distribution analysis, historical price levels, and confirmed price reaction signals in one indicator. It gives traders a way to identify areas of concentrated or limited trading activity, track their development over time, and evaluate how price interacts with them.
Volume profiles show where trading activity is concentrated across different price levels. But a standard volume profile often focuses on the current distribution, making it harder to track how important price levels develop, persist, and react over time.
Dynamic Profile Key Levels [AlgoAlpha] combines a volume profile with volume peaks, troughs, ranked volume levels, and value area boundaries. It identifies areas of high and low trading activity and displays them as price levels or zones directly on the chart.
The indicator also tracks historical levels and identifies price breaks, rejections, and retests. This helps traders study how price responds to areas of previous trading activity without relying only on the latest volume distribution.
🟠 CONCEPTS
- Volume Profile — A distribution of estimated trading volume across price levels within a selected range. Each candle's volume is distributed across its price range, with an option to use lower timeframe data for more detailed estimates.
- Point of Control (POC) — The price row with the highest estimated trading volume in the profile. It represents the most active price area within the selected range.
- Value Area (VA) — A price range containing a selected percentage of total profile volume, set to 70% by default. It expands outward from the POC toward adjacent rows with higher volume. Value Area High (VAH) and Value Area Low (VAL) mark its upper and lower boundaries.
- High Volume Nodes (HVN) — Local peaks in the volume distribution where trading activity is higher than surrounding price rows. These areas can indicate price acceptance or consolidation.
- Low Volume Nodes (LVN) — Local troughs where trading activity is lower than surrounding price rows. These areas can indicate prices where less trading occurred and where price may move more quickly.
- Ranked Volume Levels — Price rows selected by their relative volume ranking, even when they are not local peaks or troughs. They provide additional reference levels within the distribution.
- Dynamic Profile — A volume profile that starts from the latest confirmed price pivot, subject to the lookback limit. Unlike a fixed lookback, its starting point changes when a new pivot is confirmed.
- Level Break — An event where price closes on the opposite side of a previously established level or zone.
- Level Rejection — An event where price touches a level or zone and closes back on the same side.
- Level Retest — An event where price returns to a previously broken level and closes on the breakout side within the selected retest window.
🟠 FEATURES
- Adaptive Volume Profile — Displays estimated volume distribution with Fixed and Dynamic lookback modes. Supports directional coloring, separate up/down volume estimates, and relative volume coloring.
- Multiple Key Level Types — Displays POC, VAH, VAL, volume peaks, troughs, and ranked volume rows. Peak, trough, and ranked levels can be shown as horizontal lines or shaded zones.
- Historical Level Tracking — Extends identified levels across future candles and supports historical drawings. POC and value area levels also offer Current, Historical, and Developing display variants.
- Price Reaction Signals — Marks bullish and bearish breaks, rejections, and retests on confirmed candles. Includes configurable signal displays and TradingView alert conditions.
- Level Labels and Metrics Table — Displays volume share, row strength, or estimated up-volume percentages alongside selected levels. The metrics table shows value area position, POC distance, nearby levels, and relative volume, with additional information in Detailed mode.
🟠 HOW TO USE
- Select Fixed mode to analyze a consistent number of recent candles. Use Dynamic mode when you want the profile to follow the latest confirmed swing pivot.
- Start with the volume profile and value area boundaries. Observe whether price trades inside the value area, above VAH, or below VAL to understand its position relative to recent trading activity.
- Enable the POC to identify the highest-volume price row. Watch how price behaves when it approaches or moves through this level.
- Use volume peaks to identify areas of concentrated trading activity. Look for consolidation, repeated reactions, or confirmed breaks around these levels.
- Enable volume troughs to locate areas with less historical trading activity. Observe whether price moves through these areas quickly or begins forming new trading activity.
- Switch peak or trough levels to Zones when you want to analyze a wider price area instead of a single horizontal level. Adjust Zone Radius to control how many surrounding price rows are included.
- Enable Historical Nodes to compare current price action with previous volume concentrations. Use Extend Previous Nodes to keep older levels active after they disappear from the latest profile.
- Watch for rejection markers when price tests a level and closes back on its original side. Use nearby levels and market structure to assess whether the reaction has room to continue.
- Watch for break markers when price closes through an established level. If you want to analyze subsequent retests, disable Stop Extending On Break and enable Retests.
- Use the Minimum RVOL setting to require stronger trading activity before accepting signals. Higher values filter out reactions that occur on relatively low volume.
- Check the metrics table to compare the nearest levels above and below price. Their distances are expressed in ATR units, which helps compare spacing across different volatility conditions.
- Adjust Profile Resolution and Lookback Limit to suit the instrument and timeframe. Higher resolution creates narrower price rows, while a longer lookback includes more historical trading activity.
- Use the optional lower timeframe sampling to improve the detail of the estimated volume distribution when suitable data is available. The profile remains an estimate and does not represent actual exchange bid/ask volume at each price.
- Combine level reactions with price structure, trend direction, and risk management before making trading decisions. Volume concentrations identify areas of interest, not guaranteed reversal or breakout points.
🟠 CONCLUSION
Dynamic Profile Key Levels [AlgoAlpha] combines volume distribution analysis, historical price levels, and confirmed price reaction signals in one indicator. It gives traders a way to identify areas of concentrated or limited trading activity, track their development over time, and evaluate how price interacts with them.

🚨Get premium: algoalpha.io
🛜Get FREE signals: discord.gg/xCmqTVRexz
💡Tutorials: youtube.com/@AlgoAlpha
🛜Get FREE signals: discord.gg/xCmqTVRexz
💡Tutorials: youtube.com/@AlgoAlpha
免責事項
これらの情報および投稿は、TradingViewが提供または承認する金融、投資、取引、またはその他の種類の助言もしくは推奨であることを意図したものではなく、またこれらに該当するものでもありません。詳細は利用規約をご覧ください。
🚨Get premium: algoalpha.io
🛜Get FREE signals: discord.gg/xCmqTVRexz
💡Tutorials: youtube.com/@AlgoAlpha
🛜Get FREE signals: discord.gg/xCmqTVRexz
💡Tutorials: youtube.com/@AlgoAlpha
免責事項
これらの情報および投稿は、TradingViewが提供または承認する金融、投資、取引、またはその他の種類の助言もしくは推奨であることを意図したものではなく、またこれらに該当するものでもありません。詳細は利用規約をご覧ください。