OPEN-SOURCE SCRIPT
Quarter Point Autopilot v2.0.0
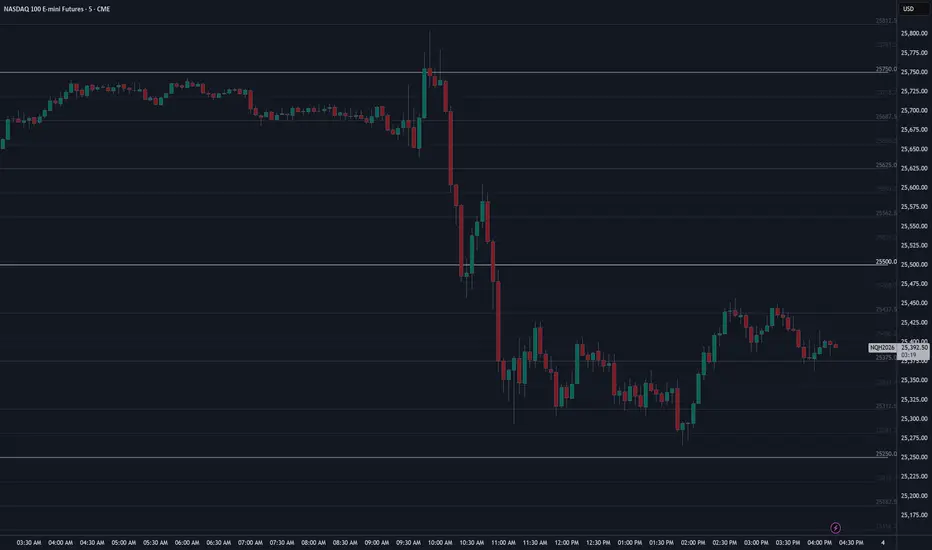
Hello traders,
I am pleased to release the Quarter Point Autopilot. This is a specialized structural framework designed to impose mathematical order on price action by synthesizing major market cycles with fractal geometric subdivisions.

Defining accurate Support and Resistance often presents a dilemma: rely on subjective, manually drawn lines that vary from trader to trader, or clutter charts with lagging moving averages. The Quarter Point Autopilot solves this by quantifying "Algorithmic Geometry." It eliminates subjectivity by projecting a universal grid based on the mathematical quarter-points that institutional algorithms utilize to execute orders.
📐 The Concept: Algorithmic Geometry
To the untrained eye, price movement can appear chaotic or random. However, professional analysis reveals that markets move in measured "Steps." Large institutions do not place orders at random numbers; they utilize specific mathematical fractions of a Major Cycle to manage liquidity.
This indicator is specifically engineered to visualize this hidden framework. By defining a "Major Cycle" (Point A and Point B), the script calculates the entire universe of the chart. It mathematically subdivides the range into Halves, Quarters, Eighths, and Sixteenths, highlighting the precise levels where price creates "Structure" and where algorithmic reactions are most likely to occur.
⚙️ The Autopilot Logic: Infinite Scroll
In previous iterations of quarter-theory tools, traders were forced to manually redraw grids as price expanded into new territories.
This version introduces the "Autopilot" engine (current_base logic). The script dynamically detects which "Block" price is currently trading within and automatically projects the grid forward and backward in real-time. Whether price rallies 1,000 points or drops 500, the mathematical subdivisions snap to the correct integer block immediately, ensuring you never trade without context.
📊 Fractal Hierarchy
Not all levels are created equal. The indicator uses a visual hierarchy to help you distinguish the strength of a level at a glance:
User Guide:
Simply input two "Major Cycle Points" (a significant High and Low) in the settings. The script calculates the "Step Size" and handles the rest, projecting the grid relative to current price action.
Settings Include:
I am pleased to release the Quarter Point Autopilot. This is a specialized structural framework designed to impose mathematical order on price action by synthesizing major market cycles with fractal geometric subdivisions.
Defining accurate Support and Resistance often presents a dilemma: rely on subjective, manually drawn lines that vary from trader to trader, or clutter charts with lagging moving averages. The Quarter Point Autopilot solves this by quantifying "Algorithmic Geometry." It eliminates subjectivity by projecting a universal grid based on the mathematical quarter-points that institutional algorithms utilize to execute orders.
📐 The Concept: Algorithmic Geometry
To the untrained eye, price movement can appear chaotic or random. However, professional analysis reveals that markets move in measured "Steps." Large institutions do not place orders at random numbers; they utilize specific mathematical fractions of a Major Cycle to manage liquidity.
This indicator is specifically engineered to visualize this hidden framework. By defining a "Major Cycle" (Point A and Point B), the script calculates the entire universe of the chart. It mathematically subdivides the range into Halves, Quarters, Eighths, and Sixteenths, highlighting the precise levels where price creates "Structure" and where algorithmic reactions are most likely to occur.
⚙️ The Autopilot Logic: Infinite Scroll
In previous iterations of quarter-theory tools, traders were forced to manually redraw grids as price expanded into new territories.
This version introduces the "Autopilot" engine (current_base logic). The script dynamically detects which "Block" price is currently trading within and automatically projects the grid forward and backward in real-time. Whether price rallies 1,000 points or drops 500, the mathematical subdivisions snap to the correct integer block immediately, ensuring you never trade without context.
📊 Fractal Hierarchy
Not all levels are created equal. The indicator uses a visual hierarchy to help you distinguish the strength of a level at a glance:
- Major Cycle: The "Hard Deck" boundaries of the range (0% / 100%).
- Half-Major: The Equilibrium of the cycle (50%).
- Large Quarters: The standard deviation points (25% / 75%).
- Mid & Small Quarters: The granular detail (Eighths and Sixteenths) for precision entries.
User Guide:
Simply input two "Major Cycle Points" (a significant High and Low) in the settings. The script calculates the "Step Size" and handles the rest, projecting the grid relative to current price action.
Settings Include:
- Calculation Group: Set your Point A and Point B to define the grid size.
- Visual Group: Toggle the upper/lower buffers and customize the lookback/lookforward lengths to keep your chart clean.
- Label Group: Choose to see Level Names, Prices, or both.
オープンソーススクリプト
TradingViewの精神に則り、このスクリプトの作者はコードをオープンソースとして公開してくれました。トレーダーが内容を確認・検証できるようにという配慮です。作者に拍手を送りましょう!無料で利用できますが、コードの再公開はハウスルールに従う必要があります。

免責事項
これらの情報および投稿は、TradingViewが提供または承認する金融、投資、取引、またはその他の種類の助言もしくは推奨であることを意図したものではなく、またこれらに該当するものでもありません。詳細は利用規約をご覧ください。
オープンソーススクリプト
TradingViewの精神に則り、このスクリプトの作者はコードをオープンソースとして公開してくれました。トレーダーが内容を確認・検証できるようにという配慮です。作者に拍手を送りましょう!無料で利用できますが、コードの再公開はハウスルールに従う必要があります。
免責事項
これらの情報および投稿は、TradingViewが提供または承認する金融、投資、取引、またはその他の種類の助言もしくは推奨であることを意図したものではなく、またこれらに該当するものでもありません。詳細は利用規約をご覧ください。