Linda Raschke Holy Grail Pullback [Jayadev Rana]
WHAT IT IS
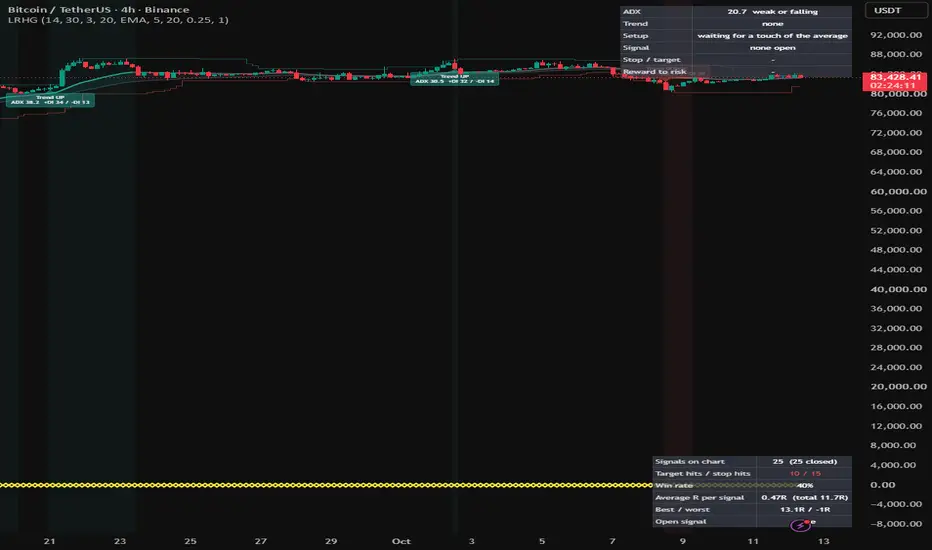
A trend-pullback signal indicator built on a well-known ADX pullback setup: wait for a strong and still-rising ADX, let price retrace to the 20-period average, and enter when price turns back in the trend direction through the touch bar's extreme. Every BUY and SELL is printed with its stop-loss and swing target, the levels are drawn as lines until the signal resolves, and every exit is labelled with its result. Labels on the trend start and on each pullback touch show the numbers behind the setup.
HOW IT WORKS
1. Trend. ADX (default 14) must be above the minimum (default 30) and higher than it was a few bars ago, and optionally +DI must be above -DI for longs (-DI above +DI for shorts). The background is tinted while a trend qualifies and a label marks the bar where it started, with ADX and both DI values.
2. Pullback touch. In an uptrend, the first bar whose low reaches the 20-period average after closing above it is the setup bar. A label shows the trigger (the touch bar high), the stop candidate, the swing target and the reward-to-risk ratio.
3. Trigger. BUY when a later bar trades above the touch bar high within the valid window (default 5 bars). While waiting, the stop candidate follows the lowest low of the pullback. The setup is cancelled if the window expires or price closes below the pullback low. Shorts are mirrored.
4. Stop and target. Stop-loss = pullback extreme minus an ATR buffer. Target = the highest high of the bars before the pullback (default 20-bar lookback). Setups whose reward-to-risk is below a minimum are skipped.
5. Exits. Stop or target; after the target is reached the remainder of the signal can trail until a close back through the average.
ON THE CHART
The pullback average coloured by trend, a slower average with a trend ribbon fill, the prior swing high and low as step lines, pending trigger circles, setup triangles, BUY / SELL labels with entry, stop and target, entry / stop / target lines with risk and reward fills, exit labels, a status table (ADX, trend, setup, stop and target, reward-to-risk) and the journal table (signals, hits, win rate, average R, best and worst, open signal R).
INPUTS
ADX length, minimum and rising bars, DI agreement, average length and type, setup validity, swing lookback, stop buffer, minimum reward-to-risk, long and short switches, trail after target, display toggles.
ALERTS
Long setup, short setup, BUY, SELL, target hit, stop hit, average exit.
INTENDED USE
Any liquid market from 15-minute to daily charts. The method needs a trending market; in ranges ADX stays low and the indicator prints nothing.
LIMITATIONS
ADX lags, so the first pullback of a trend can be missed. Targets at the prior swing can be close, which the reward-to-risk filter handles. Journal statistics count the signals on the loaded history without costs or sizing. Educational tool, not financial advice.
A trend-pullback signal indicator built on a well-known ADX pullback setup: wait for a strong and still-rising ADX, let price retrace to the 20-period average, and enter when price turns back in the trend direction through the touch bar's extreme. Every BUY and SELL is printed with its stop-loss and swing target, the levels are drawn as lines until the signal resolves, and every exit is labelled with its result. Labels on the trend start and on each pullback touch show the numbers behind the setup.
HOW IT WORKS
1. Trend. ADX (default 14) must be above the minimum (default 30) and higher than it was a few bars ago, and optionally +DI must be above -DI for longs (-DI above +DI for shorts). The background is tinted while a trend qualifies and a label marks the bar where it started, with ADX and both DI values.
2. Pullback touch. In an uptrend, the first bar whose low reaches the 20-period average after closing above it is the setup bar. A label shows the trigger (the touch bar high), the stop candidate, the swing target and the reward-to-risk ratio.
3. Trigger. BUY when a later bar trades above the touch bar high within the valid window (default 5 bars). While waiting, the stop candidate follows the lowest low of the pullback. The setup is cancelled if the window expires or price closes below the pullback low. Shorts are mirrored.
4. Stop and target. Stop-loss = pullback extreme minus an ATR buffer. Target = the highest high of the bars before the pullback (default 20-bar lookback). Setups whose reward-to-risk is below a minimum are skipped.
5. Exits. Stop or target; after the target is reached the remainder of the signal can trail until a close back through the average.
ON THE CHART
The pullback average coloured by trend, a slower average with a trend ribbon fill, the prior swing high and low as step lines, pending trigger circles, setup triangles, BUY / SELL labels with entry, stop and target, entry / stop / target lines with risk and reward fills, exit labels, a status table (ADX, trend, setup, stop and target, reward-to-risk) and the journal table (signals, hits, win rate, average R, best and worst, open signal R).
INPUTS
ADX length, minimum and rising bars, DI agreement, average length and type, setup validity, swing lookback, stop buffer, minimum reward-to-risk, long and short switches, trail after target, display toggles.
ALERTS
Long setup, short setup, BUY, SELL, target hit, stop hit, average exit.
INTENDED USE
Any liquid market from 15-minute to daily charts. The method needs a trending market; in ranges ADX stays low and the indicator prints nothing.
LIMITATIONS
ADX lags, so the first pullback of a trend can be missed. Targets at the prior swing can be close, which the reward-to-risk filter handles. Journal statistics count the signals on the loaded history without costs or sizing. Educational tool, not financial advice.

免責事項
これらの情報および投稿は、TradingViewが提供または承認する金融、投資、取引、またはその他の種類の助言もしくは推奨であることを意図したものではなく、またこれらに該当するものでもありません。詳細は利用規約をご覧ください。
免責事項
これらの情報および投稿は、TradingViewが提供または承認する金融、投資、取引、またはその他の種類の助言もしくは推奨であることを意図したものではなく、またこれらに該当するものでもありません。詳細は利用規約をご覧ください。