OPEN-SOURCE SCRIPT
更新済 Previous High/Low MTF
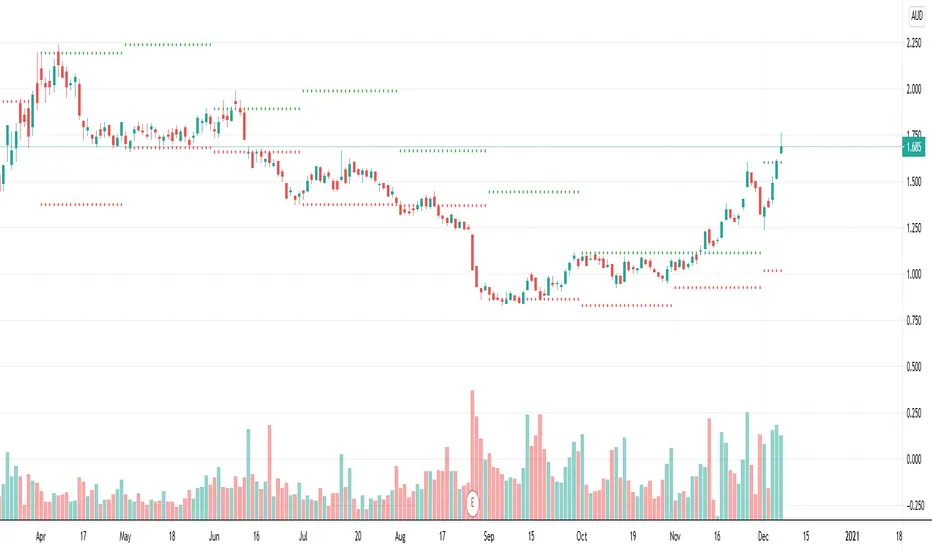
Indicator to plot higher time frame previous candle highs and lows.
One of the key factor in understanding the trend is to look at higher time-frames chart.
Parameters are explained below:
One of the key factor in understanding the trend is to look at higher time-frames chart.
Parameters are explained below:
- resolution : Chose resolution of higher timeframe. If set to same as symbol, it will consider next parameter HTFMultiplier for calculation of higher timeframe
- HTFMultiplier : Multiply symbol timeframe to by HTFMultiplier to derive higher time-frame
- Offset: Number of higher timeframe candles before to be plotted. 1 means - it will show highs/lows of previous higher timeframe candle.
リリースノート
Also adding few options to explain how lookahead, gaps and offset on security function affect output. Default settings are set to show the optimal non repaint version.オープンソーススクリプト
TradingViewの精神に則り、このスクリプトの作者はコードをオープンソースとして公開してくれました。トレーダーが内容を確認・検証できるようにという配慮です。作者に拍手を送りましょう!無料で利用できますが、コードの再公開はハウスルールに従う必要があります。

Trial - trendoscope.com/trial
Subscribe - trendoscope.com/pricing
Blog - docs.trendoscope.com
Subscribe - trendoscope.com/pricing
Blog - docs.trendoscope.com
免責事項
これらの情報および投稿は、TradingViewが提供または承認する金融、投資、取引、またはその他の種類の助言もしくは推奨であることを意図したものではなく、またこれらに該当するものでもありません。詳細は利用規約をご覧ください。
オープンソーススクリプト
TradingViewの精神に則り、このスクリプトの作者はコードをオープンソースとして公開してくれました。トレーダーが内容を確認・検証できるようにという配慮です。作者に拍手を送りましょう!無料で利用できますが、コードの再公開はハウスルールに従う必要があります。
Trial - trendoscope.com/trial
Subscribe - trendoscope.com/pricing
Blog - docs.trendoscope.com
Subscribe - trendoscope.com/pricing
Blog - docs.trendoscope.com
免責事項
これらの情報および投稿は、TradingViewが提供または承認する金融、投資、取引、またはその他の種類の助言もしくは推奨であることを意図したものではなく、またこれらに該当するものでもありません。詳細は利用規約をご覧ください。