アップデート済
RSI Candles [cI8DH]
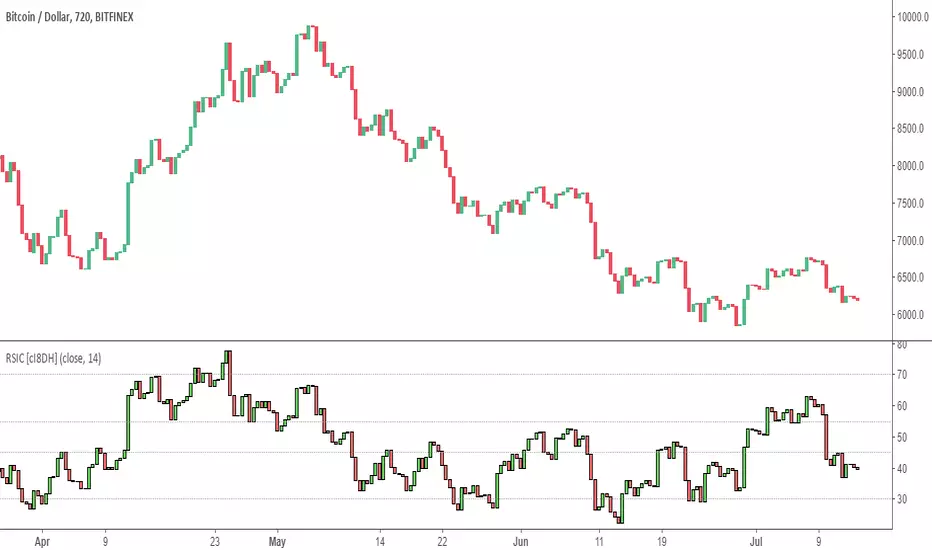
This is candle visualization of regular RSI. That's all.
I have seen two other RSI candles, but their implementation is not correct. The high on RSI usually matches the low on price and vice versa. I have completely turned off the wicks so you can safely use this indicator as a replacement for regular RSI.
I have seen two other RSI candles, but their implementation is not correct. The high on RSI usually matches the low on price and vice versa. I have completely turned off the wicks so you can safely use this indicator as a replacement for regular RSI.
リリースノート
added a band as requested by my friendリリースノート
- Added dynamic inner band that can be used during sideways periods- Implemented the True RSI fix explained here

リリースノート
- added standard deviation inner band calculation methodリリースノート
- minor code optimization
免責事項
これらの情報および投稿は、TradingViewが提供または承認する金融、投資、取引、またはその他の種類の助言もしくは推奨であることを意図したものではなく、またこれらに該当するものでもありません。詳細は利用規約をご覧ください。
免責事項
これらの情報および投稿は、TradingViewが提供または承認する金融、投資、取引、またはその他の種類の助言もしくは推奨であることを意図したものではなく、またこれらに該当するものでもありません。詳細は利用規約をご覧ください。