OPEN-SOURCE SCRIPT
SpxSnipper - Chart Stock vs Sector RS Dashboard
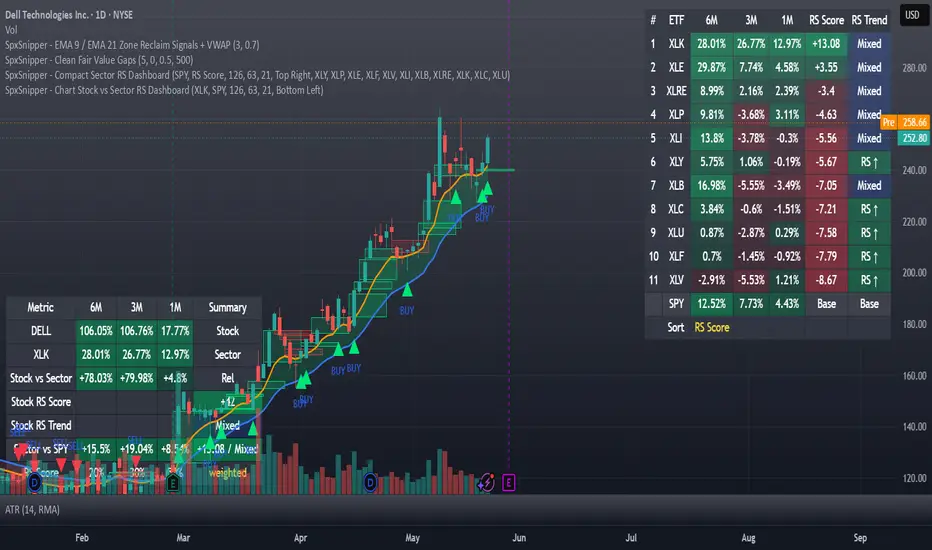
SpxSnipper - Chart Stock vs Sector RS Dashboard
This indicator displays a compact relative strength dashboard that compares the current chart symbol against a selected sector ETF.
The stock symbol is detected automatically from the active chart, so users only need to select the relevant sector ETF. SPY is used as the default benchmark for sector-level relative strength.
The dashboard is designed to help answer two practical questions:
1. Is the stock outperforming or underperforming its sector?
2. Is the selected sector outperforming or underperforming SPY?
Main features:
• Automatically uses the current chart symbol as the stock
• User-selected sector ETF
• SPY benchmark comparison
• 6-month, 3-month, and 1-month performance
• Stock relative strength versus sector
• Sector relative strength versus SPY
• Weighted RS Score
• RS Trend status
• Compact table format
Performance periods:
The dashboard calculates performance over three configurable lookback periods:
• 6M
• 3M
• 1M
By default, these are approximated using trading days:
• 6M = 126 trading days
• 3M = 63 trading days
• 1M = 21 trading days
Stock vs Sector:
This row compares the stock’s return to the selected sector ETF.
Formula:
Stock Relative Return = Stock Return - Sector ETF Return
A positive value means the stock outperformed its sector during that period.
A negative value means the stock underperformed its sector during that period.
Sector vs SPY:
This row compares the selected sector ETF to SPY.
Formula:
Sector Relative Return = Sector ETF Return - SPY Return
A positive value means the sector outperformed SPY.
A negative value means the sector underperformed SPY.
RS Score:
The RS Score is a weighted relative strength score. It combines the 6M, 3M, and 1M relative returns into one number, with more weight given to recent performance.
Formula:
RS Score =
Relative 6M × 20%
+ Relative 3M × 30%
+ Relative 1M × 50%
For the stock, the RS Score is calculated versus the selected sector ETF.
For the sector, the RS Score is calculated versus SPY.
A positive RS Score indicates weighted outperformance.
A negative RS Score indicates weighted underperformance.
RS Trend:
RS Trend evaluates whether relative strength is improving, weakening, or mixed across the three timeframes.
The logic is:
RS ↑:
Relative strength is improving from 6M to 3M to 1M.
Rel 1M > Rel 3M > Rel 6M
RS ↓:
Relative strength is weakening from 6M to 3M to 1M.
Rel 1M < Rel 3M < Rel 6M
Mixed:
There is no clear sequential improvement or deterioration.
Suggested interpretation:
• Positive Sector RS Score or RS ↑ may indicate that the sector is showing relative strength versus SPY.
• Positive Stock RS Score or RS ↑ may indicate that the stock is showing relative strength versus its sector.
• A strong stock inside a strong sector may be useful for watchlist building and relative strength analysis.
• A stock can rise in absolute terms but still underperform its sector, which this dashboard helps identify.
Customization:
Users can adjust:
• Sector ETF
• Benchmark symbol
• 6M / 3M / 1M lookback periods
• Table position
Important note:
This dashboard is intended for relative strength analysis, sector comparison, and market research. It does not generate buy or sell signals and should not be used as a standalone trading system.
This script is for educational and analytical purposes only and does not provide financial advice.
This indicator displays a compact relative strength dashboard that compares the current chart symbol against a selected sector ETF.
The stock symbol is detected automatically from the active chart, so users only need to select the relevant sector ETF. SPY is used as the default benchmark for sector-level relative strength.
The dashboard is designed to help answer two practical questions:
1. Is the stock outperforming or underperforming its sector?
2. Is the selected sector outperforming or underperforming SPY?
Main features:
• Automatically uses the current chart symbol as the stock
• User-selected sector ETF
• SPY benchmark comparison
• 6-month, 3-month, and 1-month performance
• Stock relative strength versus sector
• Sector relative strength versus SPY
• Weighted RS Score
• RS Trend status
• Compact table format
Performance periods:
The dashboard calculates performance over three configurable lookback periods:
• 6M
• 3M
• 1M
By default, these are approximated using trading days:
• 6M = 126 trading days
• 3M = 63 trading days
• 1M = 21 trading days
Stock vs Sector:
This row compares the stock’s return to the selected sector ETF.
Formula:
Stock Relative Return = Stock Return - Sector ETF Return
A positive value means the stock outperformed its sector during that period.
A negative value means the stock underperformed its sector during that period.
Sector vs SPY:
This row compares the selected sector ETF to SPY.
Formula:
Sector Relative Return = Sector ETF Return - SPY Return
A positive value means the sector outperformed SPY.
A negative value means the sector underperformed SPY.
RS Score:
The RS Score is a weighted relative strength score. It combines the 6M, 3M, and 1M relative returns into one number, with more weight given to recent performance.
Formula:
RS Score =
Relative 6M × 20%
+ Relative 3M × 30%
+ Relative 1M × 50%
For the stock, the RS Score is calculated versus the selected sector ETF.
For the sector, the RS Score is calculated versus SPY.
A positive RS Score indicates weighted outperformance.
A negative RS Score indicates weighted underperformance.
RS Trend:
RS Trend evaluates whether relative strength is improving, weakening, or mixed across the three timeframes.
The logic is:
RS ↑:
Relative strength is improving from 6M to 3M to 1M.
Rel 1M > Rel 3M > Rel 6M
RS ↓:
Relative strength is weakening from 6M to 3M to 1M.
Rel 1M < Rel 3M < Rel 6M
Mixed:
There is no clear sequential improvement or deterioration.
Suggested interpretation:
• Positive Sector RS Score or RS ↑ may indicate that the sector is showing relative strength versus SPY.
• Positive Stock RS Score or RS ↑ may indicate that the stock is showing relative strength versus its sector.
• A strong stock inside a strong sector may be useful for watchlist building and relative strength analysis.
• A stock can rise in absolute terms but still underperform its sector, which this dashboard helps identify.
Customization:
Users can adjust:
• Sector ETF
• Benchmark symbol
• 6M / 3M / 1M lookback periods
• Table position
Important note:
This dashboard is intended for relative strength analysis, sector comparison, and market research. It does not generate buy or sell signals and should not be used as a standalone trading system.
This script is for educational and analytical purposes only and does not provide financial advice.
オープンソーススクリプト
TradingViewの精神に則り、このスクリプトの作者はコードをオープンソースとして公開してくれました。トレーダーが内容を確認・検証できるようにという配慮です。作者に拍手を送りましょう!無料で利用できますが、コードの再公開はハウスルールに従う必要があります。

免責事項
これらの情報および投稿は、TradingViewが提供または承認する金融、投資、取引、またはその他の種類の助言もしくは推奨であることを意図したものではなく、またこれらに該当するものでもありません。詳細は利用規約をご覧ください。
オープンソーススクリプト
TradingViewの精神に則り、このスクリプトの作者はコードをオープンソースとして公開してくれました。トレーダーが内容を確認・検証できるようにという配慮です。作者に拍手を送りましょう!無料で利用できますが、コードの再公開はハウスルールに従う必要があります。
免責事項
これらの情報および投稿は、TradingViewが提供または承認する金融、投資、取引、またはその他の種類の助言もしくは推奨であることを意図したものではなく、またこれらに該当するものでもありません。詳細は利用規約をご覧ください。