OPEN-SOURCE SCRIPT
Dynamic ATR v1.0
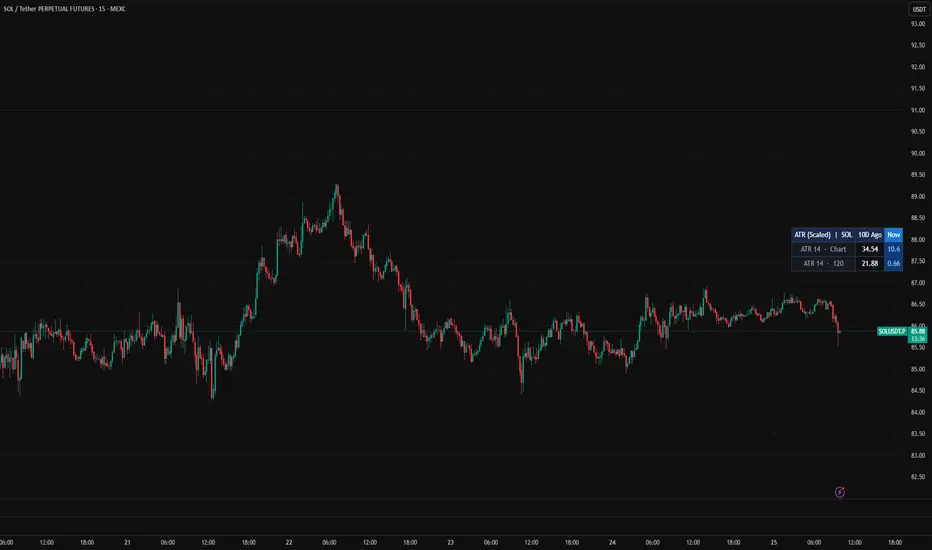
Dynamic ATR displays the Average True Range of any token across two timeframes — the chart timeframe and a configurable higher timeframe (default 2H) — with an…Dynamic ATR displays the Average True Range of any token across two timeframes — the chart timeframe and a configurable higher timeframe (default 2H) — with an optional 0–50 normalization that scales each ATR value relative to its own 360-bar history, making volatility directly comparable across different tokens regardless of their price magnitude. Alongside the current readings, it also shows a snapshot of both ATR values from 10 calendar days ago, giving you a quick sense of whether volatility has expanded or contracted recently. The result is a compact table you can position anywhere on the chart, useful for scanning multiple tokens side by side and spotting which ones are in high or low volatility regimes relative to their own history.
Created by Milad Saberi — April 2026
Created by Milad Saberi — April 2026
オープンソーススクリプト
TradingViewの精神に則り、このスクリプトの作者はコードをオープンソースとして公開してくれました。トレーダーが内容を確認・検証できるようにという配慮です。作者に拍手を送りましょう!無料で利用できますが、コードの再公開はハウスルールに従う必要があります。

免責事項
これらの情報および投稿は、TradingViewが提供または承認する金融、投資、取引、またはその他の種類の助言もしくは推奨であることを意図したものではなく、またこれらに該当するものでもありません。詳細は利用規約をご覧ください。
オープンソーススクリプト
TradingViewの精神に則り、このスクリプトの作者はコードをオープンソースとして公開してくれました。トレーダーが内容を確認・検証できるようにという配慮です。作者に拍手を送りましょう!無料で利用できますが、コードの再公開はハウスルールに従う必要があります。
免責事項
これらの情報および投稿は、TradingViewが提供または承認する金融、投資、取引、またはその他の種類の助言もしくは推奨であることを意図したものではなく、またこれらに該当するものでもありません。詳細は利用規約をご覧ください。