OPEN-SOURCE SCRIPT
Discount to Net Asset Value
Overview
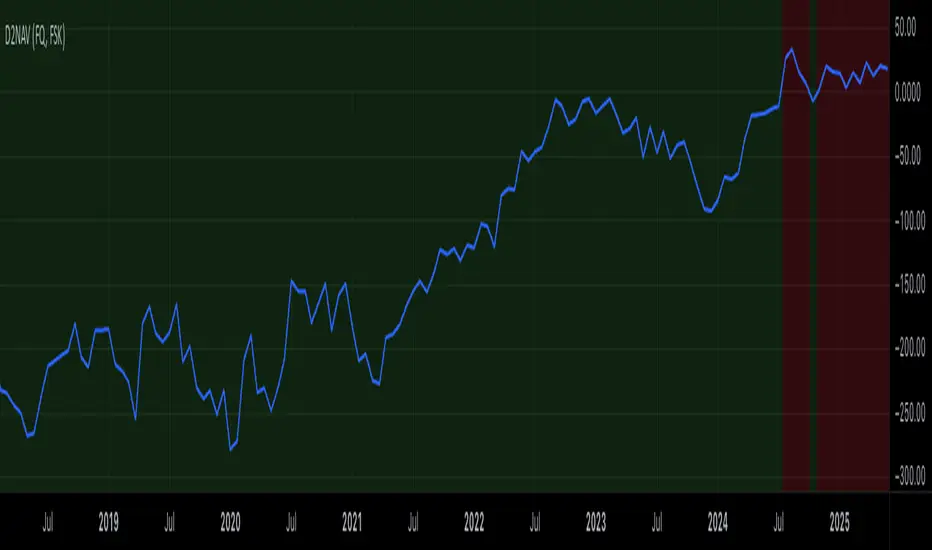
This indicator helps investors and analysts identify when a company’s stock is trading below or above its intrinsic value. A persistent discount may highlight potential value opportunities, while a sustained premium could signal overvaluation or strong market sentiment. By visually shading the background and plotting the discount/premium percentage, users can quickly screen for undervalued stocks, confirm fundamental research, and make more informed buy or sell decisions.

Usage
Calculates the Net Asset Value discount (or premium) for any symbol.
By default the indicator uses the current chart symbol’s TOTAL_ASSETS, TOTAL_LIABILITIES, and TOTAL_SHARES_OUTSTANDING.
You can select another symbol by checking “Use Custom Symbol” and entering the ticker of the other symbol. This is useful for comparing the Discount to NAV across symbols.
Shows the percentage discount (or premium) of market capitalization relative to net asset value.
Recommended timeframes: daily bars or higher.
Reporting Periods:
• FQ = Fiscal Quarter
• FY = Fiscal Year
• TTM = Trailing Twelve Months
Note: NAV is pulled on the chosen reporting period (FQ, FY, TTM).
By default the background is shaded red to illustrate a discount to NAV and green to illustrate a premium to NAV. This can be toggled in the settings.
This indicator helps investors and analysts identify when a company’s stock is trading below or above its intrinsic value. A persistent discount may highlight potential value opportunities, while a sustained premium could signal overvaluation or strong market sentiment. By visually shading the background and plotting the discount/premium percentage, users can quickly screen for undervalued stocks, confirm fundamental research, and make more informed buy or sell decisions.
Usage
Calculates the Net Asset Value discount (or premium) for any symbol.
By default the indicator uses the current chart symbol’s TOTAL_ASSETS, TOTAL_LIABILITIES, and TOTAL_SHARES_OUTSTANDING.
You can select another symbol by checking “Use Custom Symbol” and entering the ticker of the other symbol. This is useful for comparing the Discount to NAV across symbols.
Shows the percentage discount (or premium) of market capitalization relative to net asset value.
Recommended timeframes: daily bars or higher.
Reporting Periods:
• FQ = Fiscal Quarter
• FY = Fiscal Year
• TTM = Trailing Twelve Months
Note: NAV is pulled on the chosen reporting period (FQ, FY, TTM).
By default the background is shaded red to illustrate a discount to NAV and green to illustrate a premium to NAV. This can be toggled in the settings.
オープンソーススクリプト
TradingViewの精神に則り、このスクリプトの作者はコードをオープンソースとして公開してくれました。トレーダーが内容を確認・検証できるようにという配慮です。作者に拍手を送りましょう!無料で利用できますが、コードの再公開はハウスルールに従う必要があります。

Follow me on X for all my thoughts on the markets!
x.com/quickshiftinn
Signup with my Robinhood link and we'll both pick our own gift stock 🎁
bit.ly/4cm60iA
Use my link to get a Tradingview deal!
bit.ly/46wEqLE
x.com/quickshiftinn
Signup with my Robinhood link and we'll both pick our own gift stock 🎁
bit.ly/4cm60iA
Use my link to get a Tradingview deal!
bit.ly/46wEqLE
免責事項
これらの情報および投稿は、TradingViewが提供または承認する金融、投資、取引、またはその他の種類の助言もしくは推奨であることを意図したものではなく、またこれらに該当するものでもありません。詳細は利用規約をご覧ください。
オープンソーススクリプト
TradingViewの精神に則り、このスクリプトの作者はコードをオープンソースとして公開してくれました。トレーダーが内容を確認・検証できるようにという配慮です。作者に拍手を送りましょう!無料で利用できますが、コードの再公開はハウスルールに従う必要があります。
Follow me on X for all my thoughts on the markets!
x.com/quickshiftinn
Signup with my Robinhood link and we'll both pick our own gift stock 🎁
bit.ly/4cm60iA
Use my link to get a Tradingview deal!
bit.ly/46wEqLE
x.com/quickshiftinn
Signup with my Robinhood link and we'll both pick our own gift stock 🎁
bit.ly/4cm60iA
Use my link to get a Tradingview deal!
bit.ly/46wEqLE
免責事項
これらの情報および投稿は、TradingViewが提供または承認する金融、投資、取引、またはその他の種類の助言もしくは推奨であることを意図したものではなく、またこれらに該当するものでもありません。詳細は利用規約をご覧ください。