アップデート済
smile multi time frame
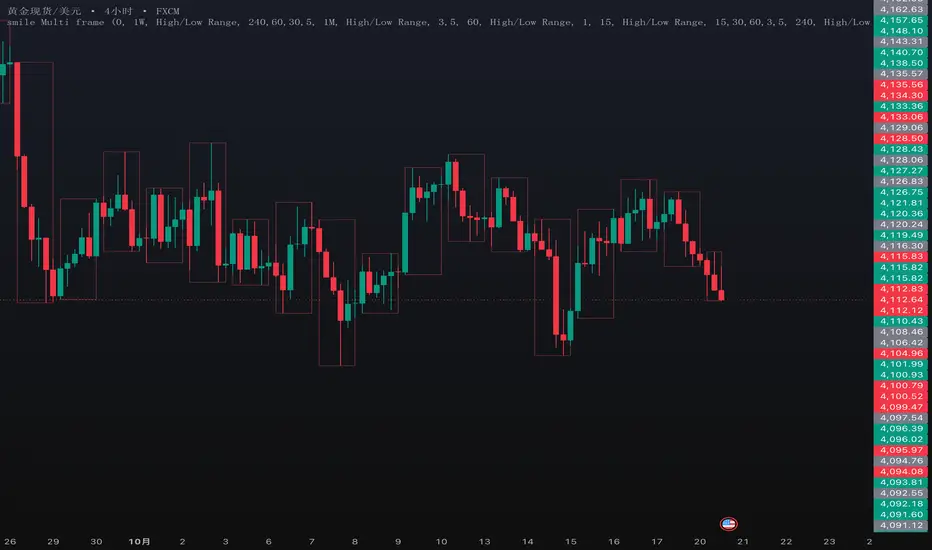
## Overview
smile Multi frame is a Pine Script v6 overlay indicator for displaying multiple timeframe ranges directly on the current price chart.
It organizes price-range boxes into five independently configurable layers: Weekly, Daily / Automatic, 4-Hour, 1-Hour, and 15-Minute. Each layer has its own timeframe settings, calculation options, colors, and chart-timeframe visibility rules.
The purpose is to help users compare smaller-timeframe price action with larger-timeframe ranges while keeping the displayed information appropriate to their current chart. Users can decide which layers appear on each chart timeframe instead of manually changing the same settings every time they switch charts.
The indicator provides visual context for discretionary analysis. It does not generate entry or exit signals, execute trades, calculate position sizes, or provide a strategy backtest.
## 1. Layers and default settings
The names of the settings groups describe their intended default roles. They do not permanently lock a layer to the timeframe in its name.
| Settings group | English meaning | Default box timeframe | Default chart visibility |
| -------------- | ----------------------- | ---------------------- | ---------------------------- |
| 周线框 | Weekly layer | 1 week | ALL |
| 日线框 | Daily / Automatic layer | Automatically selected | ALL |
| 4小时框 | 4-Hour layer | 240 minutes | ALL |
| 1小时框 | 1-Hour layer | 60 minutes | 3-minute and 5-minute charts |
| 15分钟框 | 15-Minute layer | 15 minutes | 1-minute charts |
All five layers default to High/Low Range.
The Weekly, 4-Hour, and 1-Hour layers allow box resolutions of 60, 120, 240, 360, or 720 minutes, as well as 1 day, 1 week, or 1 month. The 15-Minute layer also includes a 15-minute option.
The Daily / Automatic layer has a separate automatic-timeframe setting and a manual Timeframe selector.
Border and fill colors are independently configurable for each layer. This allows users to distinguish overlapping ranges or make background layers more transparent.
## 2. Chart-timeframe visibility
The Chinese input label “显示图表周期” means “Chart timeframes on which this layer is displayed.”
This input controls where a layer is visible. It is separate from the timeframe used to calculate that layer’s boxes.
Use comma-separated TradingView timeframe identifiers:
* `1`: display on a 1-minute chart.
* `3,5`: display on 3-minute and 5-minute charts.
* `15,60`: display on 15-minute and 1-hour charts.
* `1D`: display on a daily chart.
* `1W`: display on a weekly chart.
* `1M`: display on a monthly chart.
* `ALL`: remove the chart-timeframe visibility filter.
* An empty field hides that layer.
Minute-based timeframes use their number of minutes. For example, use `60` for one hour and `240` for four hours. Separate multiple entries with English commas.
For example, a layer with Box Resolution set to `60` and visibility set to `3,5` displays hourly ranges only when the chart is set to 3 or 5 minutes.
`ALL` controls visibility only. It does not ensure that every combination of chart timeframe and box timeframe is suitable.
## 3. Range calculation methods
### High/Low Range
The box spans the selected period’s highest and lowest prices.
This mode shows the full price range of the period, including movement outside the candle body.
### True Range
The range includes the previous selected-period close:
* Upper boundary: the higher of the current period’s high and the previous period’s close.
* Lower boundary: the lower of the current period’s low and the previous period’s close.
This can include the distance between a previous close and the next period’s trading range. It displays a range rather than calculating an average such as ATR.
### Heikin Ashi Range
The Weekly, 4-Hour, 1-Hour, and 15-Minute layers offer a Heikin Ashi Range calculation mode.
In this mode, the box boundaries use Heikin Ashi high and low values. These are synthetic candle values and should not be interpreted as executable market prices.
On standard candlestick charts, these four layers continue to determine their up/down colors from the standard open-close relationship, even when their boundaries use Heikin Ashi values.
### Additional modes in the Daily / Automatic layer
The Daily / Automatic layer provides four calculation choices:
* **High/Low Range:** the full high-low range.
* **Open/Close Range:** the range between the period’s open and close.
* **OHLC:** a high-low range box together with an additional open-close body box.
* **True Range:** the range including the previous period’s close.
This layer has a separate “Display Heikin Ashi values” option. When enabled, its selected calculation mode and up/down colors use Heikin Ashi data.
## 4. Automatic timeframe selection
Automatic selection applies to the Daily / Automatic layer.
With “Auto-timeframe” enabled, the script selects the following period:
| Current chart timeframe | Automatically selected box timeframe |
| ----------------------------------- | ------------------------------------ |
| Seconds-based charts | 2 hours |
| Non-seconds charts below 1 day | 1440 minutes |
| At least 1 day and below 1 week | 1 week |
| At least 1 week and below 1 month | 1 month |
| At least 1 month and below 3 months | 3 months |
| 3 months or higher | 12 months |
For example, this layer displays a daily-scale range on a 5-minute chart, a weekly range on a daily chart, and a monthly range on a weekly chart.
To use a fixed period, turn off “Auto-timeframe” and select the required value under “Timeframe.” The stored manual default is `1M`, so users who want a fixed daily range should explicitly select a daily timeframe.
The group is named “日线框,” but its actual calculation period follows these settings.
## 5. Data sources and colors
The Daily / Automatic layer includes a “Use daily-based values” option.
When disabled, which is the default, the script aggregates the current chart’s price data into the selected period. The available chart data and displayed trading sessions can therefore affect the resulting range.
When enabled, the layer requests the selected timeframe’s OHLC data through TradingView’s data feed. Despite the option’s name, the requested timeframe still follows the automatic or manual selection; it is not always one day.
These two methods can produce different values for some instruments or session configurations, including charts that display extended trading hours.
By default:
* A close below the open uses the down color.
* A close equal to or above the open uses the up color.
* Up colors are teal and down colors are red.
* Border and fill colors can be changed independently.
The colors describe the selected period’s open-close relationship. They do not represent an independently calculated trend score or a trade recommendation.
## 6. Practical use
A typical workflow is to select a smaller chart timeframe and display the larger ranges that are relevant to that chart.
Examples include:
* On a 1-minute chart, use the 15-Minute layer to see how short-term movement develops inside a 15-minute period.
* On a 3-minute or 5-minute chart, use the 1-Hour layer to compare local price action with the hourly range.
* Set the 4-Hour layer’s visibility to `15,60` if it should appear only on 15-minute and 1-hour charts.
* Use the Weekly and Daily / Automatic layers for broader context, with lighter fills where several boxes overlap.
Users can compare price with period extremes, observe range expansion or contraction, and review how smaller candles formed a larger period’s range. Interpretation and trading decisions remain with the user.
## 7. Live updates, historical display, and limitations
**Developing periods change.** The active period’s range and color can change as new prices arrive. Its final high, low, and close are not confirmed before that period ends.
**Historical boxes summarize completed periods.** For the standard High/Low and True Range paths, the script creates the completed period’s box when the next period begins and draws it across the period it represents. A completed historical box must not be interpreted as information that was fully available at the beginning of that period.
**The active box is not displayed on the first chart bar of a new selected period.** Under the intended lower-chart / higher-box setup, it appears after the chart advances beyond that first bar and extends only as far as the current chart bar.
**Heikin Ashi requires additional care.** In the Weekly, 4-Hour, 1-Hour, and 15-Minute layers, Heikin Ashi ranges are requested separately from the standard OHLC values used for colors. Their alignment at period transitions may differ between live updates and recalculated historical data. These values should not be treated as fixed, confirmed price levels while the relevant data is still developing.
**Drawing capacity is shared.** The script sets a maximum of 500 box objects for the entire indicator, shared by all layers. The Daily layer’s OHLC mode uses two boxes per represented period. The retained history therefore depends on the enabled layers and calculation modes, and older boxes are removed as drawing limits are reached.
**Use suitable timeframe combinations.** The intended use is to view higher-period ranges on lower, standard time-based charts. A box timeframe equal to or below the chart timeframe can produce narrow or incomplete representations. The indicator does not reconstruct every lower-timeframe candle inside a higher-timeframe chart bar.
**History and data limits apply.** Very small chart timeframes combined with very long box periods can encounter historical-data or drawing-coordinate limits. Data-feed revisions, session settings, and available history may also affect displayed values.
The indicator should not be described as entirely non-repainting. Its developing-period display is intentionally dynamic, and historical boxes do not establish trading performance.
## 8. Source acknowledgement and purpose of the integration
The Daily / Automatic layer is adapted from TradingView’s built-in Multi-Time Period Charts indicator.
This version brings multiple range-box layers into one configurable overlay and adds chart-timeframe visibility control for each layer. The practical contribution is to coordinate broader context and shorter-period detail within one workspace, while allowing users to reduce overlap and show the layers relevant to each chart timeframe.
The underlying range methods use standard OHLC, True Range, and Heikin Ashi concepts. The combined layout and visibility rules are intended to support chart organization and multi-timeframe observation.
---
## 中文说明
### 一、指标作用
smile Multi frame 是一个多周期价格区间叠加指标,用于在当前图表上,同时观察不同周期的价格运行范围。
指标包含周线、日线/自动周期、4小时、1小时和15分钟五组区间框。每组可以分别设置计算周期、区间计算方式、上涨和下跌颜色,以及在哪些图表周期中显示。
它主要解决两个看盘问题:
1. 在观察小周期价格变化时,保留较大周期的区间背景。
2. 切换图表周期时,根据预先设置的规则显示相应区间框,减少反复修改设置和画面遮挡。
指标提供的是价格区间和周期关系的可视化信息。交易方向、入场条件、止损和仓位仍需使用者自行判断。
### 二、各组默认设置
* **周线框:**默认计算一周的价格范围,显示周期设为 `ALL`。
* **日线框:**默认开启自动周期选择,显示周期设为 `ALL`。在分钟图中采用日级区间;切换到日线、周线等图表后,会自动选择其他周期。
* **4小时框:**默认计算4小时范围,显示周期设为 `ALL`。
* **1小时框:**默认计算1小时范围,仅在3分钟和5分钟图表中显示。
* **15分钟框:**默认计算15分钟范围,仅在1分钟图表中显示。
五组默认均采用 High/Low Range,也就是最高价至最低价的完整区间。
分组名称只是便于使用的预设名称。例如,“周线框”的计算周期可以改为日线或月线;修改后,应以实际设置的周期为准。
### 三、“框的计算周期”和“显示图表周期”的区别
这两个设置分别控制不同的事情:
**框的计算周期**决定一个框代表多长时间。例如,`60` 表示每个框代表1小时,`240` 表示每个框代表4小时。
**显示图表周期**决定这组框在哪些图表上出现。例如,填写 `3,5`,表示只在3分钟和5分钟图上显示。
因此,将1小时框设置为:
* Box Resolution:`60`
* 显示图表周期:`3,5`
表示在3分钟和5分钟图上叠加1小时区间。
多个显示周期用英文逗号分隔。1小时填写 `60`,4小时填写 `240`,日线填写 `1D`,周线填写 `1W`,月线填写 `1M`。填写 `ALL` 表示取消这一组的显示周期过滤;清空该字段则隐藏该组。
需要注意,`ALL` 只是显示设置,并不代表任何大小周期组合都能完整呈现。
### 四、区间计算方式
**1. High/Low Range:最高价与最低价区间**
用所选周期的最高价和最低价确定框的上下边界,展示该周期的完整价格波动范围。
适合观察价格在该周期范围中的位置,以及不同周期之间的包含关系。
**2. True Range:包含前收盘价的区间**
上边界取本周期最高价与上一周期收盘价中的较大值;下边界取本周期最低价与上一周期收盘价中的较小值。
这种方式会把前收盘价与本周期范围之间的距离纳入显示。这里展示的是区间,没有进行 ATR 的平均计算。
**3. Heikin Ashi Range:平均K线区间**
周线、4小时、1小时和15分钟组可以使用 Heikin Ashi 的最高值和最低值绘框。
Heikin Ashi 属于经过计算的合成价格,不能把这些边界直接理解为真实成交价。在普通K线图中,这四组切换到该模式后,框的边界使用 Heikin Ashi 数据,涨跌颜色仍按普通 OHLC 数据的开收关系判断。
**4. 日线/自动周期组的额外选项**
这一组另外提供:
* **Open/Close Range:**展示开盘价与收盘价之间的实体范围。
* **OHLC:**同时展示完整高低区间和开收实体区间,每个周期使用两个矩形框。
该组还可以单独开启“Display Heikin Ashi values”。开启后,其区间计算和涨跌颜色均基于 Heikin Ashi 数据。
### 五、日线组的自动周期与数据选项
“日线框”并不是固定只显示日线。
开启 Auto-timeframe 后,会根据当前图表选择对应周期。例如:
* 秒级图表:采用2小时框。
* 分钟级日内图表:采用1440分钟的日级框。
* 日线图表:采用周线框。
* 周线图表:采用月线框。
* 月线图表:采用3个月框。
* 3个月及以上图表:选择12个月框。
如果需要固定显示日线,应关闭 Auto-timeframe,然后在 Timeframe 中选择日线。手动周期保存的默认值是 `1M`,关闭自动选择后需要检查这一项。
“Use daily-based values”控制数据获取方式:
* **关闭时:**根据当前图表数据汇总所选周期的价格范围。
* **开启时:**获取数据源提供的所选周期 OHLC 数据。
它的名称虽然包含 daily,但实际请求周期仍由自动或手动设置决定。
在部分品种或不同交易时段设置下,两种方式可能得到不同结果。例如,图表是否包含盘前盘后数据,会影响部分日内汇总结果。
### 六、颜色的含义
默认情况下,收盘价低于开盘价使用下跌色;收盘价等于或高于开盘价使用上涨色。
默认上涨为青绿色,下跌为红色。每组的边框和填充颜色可以分别修改,也可以调整透明度,以便区分多个周期。
这些颜色说明的是对应周期的开收关系,不构成单独的趋势确认或交易信号。
### 七、使用示例
**在1分钟图上观察15分钟范围**
保留15分钟组的默认设置,即可看到1分钟价格变化处于哪个15分钟区间中,并观察这一段区间如何逐步形成。
**在3分钟或5分钟图上观察1小时范围**
保留1小时组的默认设置,可以把当前的小周期波动放到1小时背景中理解,例如观察价格接近该小时高点、低点,还是处于范围内部。
**在15分钟和1小时图上显示4小时范围**
将4小时组的“显示图表周期”设置为 `15,60`,即可只在这两个图表周期显示4小时框。
**叠加更大周期背景**
根据需要保留周线和日线/自动周期组。多个区间重叠时,可以降低背景框的填充不透明度,减少对当前K线的遮挡。
这些用法主要帮助整理图表、对照周期和复盘区间形成过程,脚本本身没有自动买卖提醒或下单功能。
### 八、实时更新与使用限制
**当前周期的框会变化。**
所选周期尚未结束时,最高价、最低价、收盘价和涨跌颜色仍可能变化。当前显示的范围不能提前当作该周期的最终结果。
**历史完整框是对已经发生的行情进行汇总。**
在普通高低区间和 True Range 的绘制流程中,脚本在下一周期开始时绘制刚结束周期的完整框,并将其覆盖到对应的历史区间上。
因此,历史图上看到的最终框,不代表在该周期刚开始时,就已经知道后面会出现的最高价和最低价。
**新周期第一根图表K线上,当前框暂不显示。**
在较小图表周期叠加较大框周期的正常用法下,进入该周期后续图表K线时,当前框才开始显示。框的右侧更新到当前图表位置,不提前延伸至整个周期结束。
**Heikin Ashi 模式需要注意周期切换时的数据对齐。**
周线、4小时、1小时和15分钟组中的 Heikin Ashi 范围采用独立的数据请求。在周期切换附近,实时更新与重新加载后的历史显示可能存在差异,不宜把尚在变化的数据作为已经固定的确认价位。
**所有组共同使用绘图数量上限。**
整个指标最多保留500个框对象,并非每组各保留500个。日线组的 OHLC 模式每个周期需要两个框,因此显示组数和计算模式会影响可保留的历史长度。
**优先采用小周期图表观察大周期范围。**
建议将框的计算周期设为高于当前图表周期。相同周期或更低周期的组合,可能出现框宽度很窄或信息不完整的情况;该脚本不会在一根大周期K线内部还原所有小周期K线。
**数据和图形定位限制仍然适用。**
极小图表周期叠加很长的框周期,可能受到可用历史数据和图形定位范围的限制。不同数据源、交易时段设置及数据修订,也可能影响区间显示。
本指标的当前周期显示是动态的,不应将其理解为所有图形一旦出现就永不改变,也不能根据历史完整区间框推导实际交易收益。
### 九、来源说明与本版本的整合目的
本指标中的日线/自动周期模块基于 TradingView 内置的 Multi-Time Period Charts 指标进行适配。
本版本将多组周期区间集中到一个叠加指标中,并为每组提供独立的周期设置、配色设置和图表周期可见性控制。
这种组合的用途,是让较大周期背景与较小周期细节能够在同一张图中配合观察,并通过不同图表周期下的显示规则,控制重叠和遮挡。
基础区间计算采用 OHLC、True Range 和 Heikin Ashi 等常见方法;本版本侧重多组区间的组织、配置与显示管理。
smile Multi frame is a Pine Script v6 overlay indicator for displaying multiple timeframe ranges directly on the current price chart.
It organizes price-range boxes into five independently configurable layers: Weekly, Daily / Automatic, 4-Hour, 1-Hour, and 15-Minute. Each layer has its own timeframe settings, calculation options, colors, and chart-timeframe visibility rules.
The purpose is to help users compare smaller-timeframe price action with larger-timeframe ranges while keeping the displayed information appropriate to their current chart. Users can decide which layers appear on each chart timeframe instead of manually changing the same settings every time they switch charts.
The indicator provides visual context for discretionary analysis. It does not generate entry or exit signals, execute trades, calculate position sizes, or provide a strategy backtest.
## 1. Layers and default settings
The names of the settings groups describe their intended default roles. They do not permanently lock a layer to the timeframe in its name.
| Settings group | English meaning | Default box timeframe | Default chart visibility |
| -------------- | ----------------------- | ---------------------- | ---------------------------- |
| 周线框 | Weekly layer | 1 week | ALL |
| 日线框 | Daily / Automatic layer | Automatically selected | ALL |
| 4小时框 | 4-Hour layer | 240 minutes | ALL |
| 1小时框 | 1-Hour layer | 60 minutes | 3-minute and 5-minute charts |
| 15分钟框 | 15-Minute layer | 15 minutes | 1-minute charts |
All five layers default to High/Low Range.
The Weekly, 4-Hour, and 1-Hour layers allow box resolutions of 60, 120, 240, 360, or 720 minutes, as well as 1 day, 1 week, or 1 month. The 15-Minute layer also includes a 15-minute option.
The Daily / Automatic layer has a separate automatic-timeframe setting and a manual Timeframe selector.
Border and fill colors are independently configurable for each layer. This allows users to distinguish overlapping ranges or make background layers more transparent.
## 2. Chart-timeframe visibility
The Chinese input label “显示图表周期” means “Chart timeframes on which this layer is displayed.”
This input controls where a layer is visible. It is separate from the timeframe used to calculate that layer’s boxes.
Use comma-separated TradingView timeframe identifiers:
* `1`: display on a 1-minute chart.
* `3,5`: display on 3-minute and 5-minute charts.
* `15,60`: display on 15-minute and 1-hour charts.
* `1D`: display on a daily chart.
* `1W`: display on a weekly chart.
* `1M`: display on a monthly chart.
* `ALL`: remove the chart-timeframe visibility filter.
* An empty field hides that layer.
Minute-based timeframes use their number of minutes. For example, use `60` for one hour and `240` for four hours. Separate multiple entries with English commas.
For example, a layer with Box Resolution set to `60` and visibility set to `3,5` displays hourly ranges only when the chart is set to 3 or 5 minutes.
`ALL` controls visibility only. It does not ensure that every combination of chart timeframe and box timeframe is suitable.
## 3. Range calculation methods
### High/Low Range
The box spans the selected period’s highest and lowest prices.
This mode shows the full price range of the period, including movement outside the candle body.
### True Range
The range includes the previous selected-period close:
* Upper boundary: the higher of the current period’s high and the previous period’s close.
* Lower boundary: the lower of the current period’s low and the previous period’s close.
This can include the distance between a previous close and the next period’s trading range. It displays a range rather than calculating an average such as ATR.
### Heikin Ashi Range
The Weekly, 4-Hour, 1-Hour, and 15-Minute layers offer a Heikin Ashi Range calculation mode.
In this mode, the box boundaries use Heikin Ashi high and low values. These are synthetic candle values and should not be interpreted as executable market prices.
On standard candlestick charts, these four layers continue to determine their up/down colors from the standard open-close relationship, even when their boundaries use Heikin Ashi values.
### Additional modes in the Daily / Automatic layer
The Daily / Automatic layer provides four calculation choices:
* **High/Low Range:** the full high-low range.
* **Open/Close Range:** the range between the period’s open and close.
* **OHLC:** a high-low range box together with an additional open-close body box.
* **True Range:** the range including the previous period’s close.
This layer has a separate “Display Heikin Ashi values” option. When enabled, its selected calculation mode and up/down colors use Heikin Ashi data.
## 4. Automatic timeframe selection
Automatic selection applies to the Daily / Automatic layer.
With “Auto-timeframe” enabled, the script selects the following period:
| Current chart timeframe | Automatically selected box timeframe |
| ----------------------------------- | ------------------------------------ |
| Seconds-based charts | 2 hours |
| Non-seconds charts below 1 day | 1440 minutes |
| At least 1 day and below 1 week | 1 week |
| At least 1 week and below 1 month | 1 month |
| At least 1 month and below 3 months | 3 months |
| 3 months or higher | 12 months |
For example, this layer displays a daily-scale range on a 5-minute chart, a weekly range on a daily chart, and a monthly range on a weekly chart.
To use a fixed period, turn off “Auto-timeframe” and select the required value under “Timeframe.” The stored manual default is `1M`, so users who want a fixed daily range should explicitly select a daily timeframe.
The group is named “日线框,” but its actual calculation period follows these settings.
## 5. Data sources and colors
The Daily / Automatic layer includes a “Use daily-based values” option.
When disabled, which is the default, the script aggregates the current chart’s price data into the selected period. The available chart data and displayed trading sessions can therefore affect the resulting range.
When enabled, the layer requests the selected timeframe’s OHLC data through TradingView’s data feed. Despite the option’s name, the requested timeframe still follows the automatic or manual selection; it is not always one day.
These two methods can produce different values for some instruments or session configurations, including charts that display extended trading hours.
By default:
* A close below the open uses the down color.
* A close equal to or above the open uses the up color.
* Up colors are teal and down colors are red.
* Border and fill colors can be changed independently.
The colors describe the selected period’s open-close relationship. They do not represent an independently calculated trend score or a trade recommendation.
## 6. Practical use
A typical workflow is to select a smaller chart timeframe and display the larger ranges that are relevant to that chart.
Examples include:
* On a 1-minute chart, use the 15-Minute layer to see how short-term movement develops inside a 15-minute period.
* On a 3-minute or 5-minute chart, use the 1-Hour layer to compare local price action with the hourly range.
* Set the 4-Hour layer’s visibility to `15,60` if it should appear only on 15-minute and 1-hour charts.
* Use the Weekly and Daily / Automatic layers for broader context, with lighter fills where several boxes overlap.
Users can compare price with period extremes, observe range expansion or contraction, and review how smaller candles formed a larger period’s range. Interpretation and trading decisions remain with the user.
## 7. Live updates, historical display, and limitations
**Developing periods change.** The active period’s range and color can change as new prices arrive. Its final high, low, and close are not confirmed before that period ends.
**Historical boxes summarize completed periods.** For the standard High/Low and True Range paths, the script creates the completed period’s box when the next period begins and draws it across the period it represents. A completed historical box must not be interpreted as information that was fully available at the beginning of that period.
**The active box is not displayed on the first chart bar of a new selected period.** Under the intended lower-chart / higher-box setup, it appears after the chart advances beyond that first bar and extends only as far as the current chart bar.
**Heikin Ashi requires additional care.** In the Weekly, 4-Hour, 1-Hour, and 15-Minute layers, Heikin Ashi ranges are requested separately from the standard OHLC values used for colors. Their alignment at period transitions may differ between live updates and recalculated historical data. These values should not be treated as fixed, confirmed price levels while the relevant data is still developing.
**Drawing capacity is shared.** The script sets a maximum of 500 box objects for the entire indicator, shared by all layers. The Daily layer’s OHLC mode uses two boxes per represented period. The retained history therefore depends on the enabled layers and calculation modes, and older boxes are removed as drawing limits are reached.
**Use suitable timeframe combinations.** The intended use is to view higher-period ranges on lower, standard time-based charts. A box timeframe equal to or below the chart timeframe can produce narrow or incomplete representations. The indicator does not reconstruct every lower-timeframe candle inside a higher-timeframe chart bar.
**History and data limits apply.** Very small chart timeframes combined with very long box periods can encounter historical-data or drawing-coordinate limits. Data-feed revisions, session settings, and available history may also affect displayed values.
The indicator should not be described as entirely non-repainting. Its developing-period display is intentionally dynamic, and historical boxes do not establish trading performance.
## 8. Source acknowledgement and purpose of the integration
The Daily / Automatic layer is adapted from TradingView’s built-in Multi-Time Period Charts indicator.
This version brings multiple range-box layers into one configurable overlay and adds chart-timeframe visibility control for each layer. The practical contribution is to coordinate broader context and shorter-period detail within one workspace, while allowing users to reduce overlap and show the layers relevant to each chart timeframe.
The underlying range methods use standard OHLC, True Range, and Heikin Ashi concepts. The combined layout and visibility rules are intended to support chart organization and multi-timeframe observation.
---
## 中文说明
### 一、指标作用
smile Multi frame 是一个多周期价格区间叠加指标,用于在当前图表上,同时观察不同周期的价格运行范围。
指标包含周线、日线/自动周期、4小时、1小时和15分钟五组区间框。每组可以分别设置计算周期、区间计算方式、上涨和下跌颜色,以及在哪些图表周期中显示。
它主要解决两个看盘问题:
1. 在观察小周期价格变化时,保留较大周期的区间背景。
2. 切换图表周期时,根据预先设置的规则显示相应区间框,减少反复修改设置和画面遮挡。
指标提供的是价格区间和周期关系的可视化信息。交易方向、入场条件、止损和仓位仍需使用者自行判断。
### 二、各组默认设置
* **周线框:**默认计算一周的价格范围,显示周期设为 `ALL`。
* **日线框:**默认开启自动周期选择,显示周期设为 `ALL`。在分钟图中采用日级区间;切换到日线、周线等图表后,会自动选择其他周期。
* **4小时框:**默认计算4小时范围,显示周期设为 `ALL`。
* **1小时框:**默认计算1小时范围,仅在3分钟和5分钟图表中显示。
* **15分钟框:**默认计算15分钟范围,仅在1分钟图表中显示。
五组默认均采用 High/Low Range,也就是最高价至最低价的完整区间。
分组名称只是便于使用的预设名称。例如,“周线框”的计算周期可以改为日线或月线;修改后,应以实际设置的周期为准。
### 三、“框的计算周期”和“显示图表周期”的区别
这两个设置分别控制不同的事情:
**框的计算周期**决定一个框代表多长时间。例如,`60` 表示每个框代表1小时,`240` 表示每个框代表4小时。
**显示图表周期**决定这组框在哪些图表上出现。例如,填写 `3,5`,表示只在3分钟和5分钟图上显示。
因此,将1小时框设置为:
* Box Resolution:`60`
* 显示图表周期:`3,5`
表示在3分钟和5分钟图上叠加1小时区间。
多个显示周期用英文逗号分隔。1小时填写 `60`,4小时填写 `240`,日线填写 `1D`,周线填写 `1W`,月线填写 `1M`。填写 `ALL` 表示取消这一组的显示周期过滤;清空该字段则隐藏该组。
需要注意,`ALL` 只是显示设置,并不代表任何大小周期组合都能完整呈现。
### 四、区间计算方式
**1. High/Low Range:最高价与最低价区间**
用所选周期的最高价和最低价确定框的上下边界,展示该周期的完整价格波动范围。
适合观察价格在该周期范围中的位置,以及不同周期之间的包含关系。
**2. True Range:包含前收盘价的区间**
上边界取本周期最高价与上一周期收盘价中的较大值;下边界取本周期最低价与上一周期收盘价中的较小值。
这种方式会把前收盘价与本周期范围之间的距离纳入显示。这里展示的是区间,没有进行 ATR 的平均计算。
**3. Heikin Ashi Range:平均K线区间**
周线、4小时、1小时和15分钟组可以使用 Heikin Ashi 的最高值和最低值绘框。
Heikin Ashi 属于经过计算的合成价格,不能把这些边界直接理解为真实成交价。在普通K线图中,这四组切换到该模式后,框的边界使用 Heikin Ashi 数据,涨跌颜色仍按普通 OHLC 数据的开收关系判断。
**4. 日线/自动周期组的额外选项**
这一组另外提供:
* **Open/Close Range:**展示开盘价与收盘价之间的实体范围。
* **OHLC:**同时展示完整高低区间和开收实体区间,每个周期使用两个矩形框。
该组还可以单独开启“Display Heikin Ashi values”。开启后,其区间计算和涨跌颜色均基于 Heikin Ashi 数据。
### 五、日线组的自动周期与数据选项
“日线框”并不是固定只显示日线。
开启 Auto-timeframe 后,会根据当前图表选择对应周期。例如:
* 秒级图表:采用2小时框。
* 分钟级日内图表:采用1440分钟的日级框。
* 日线图表:采用周线框。
* 周线图表:采用月线框。
* 月线图表:采用3个月框。
* 3个月及以上图表:选择12个月框。
如果需要固定显示日线,应关闭 Auto-timeframe,然后在 Timeframe 中选择日线。手动周期保存的默认值是 `1M`,关闭自动选择后需要检查这一项。
“Use daily-based values”控制数据获取方式:
* **关闭时:**根据当前图表数据汇总所选周期的价格范围。
* **开启时:**获取数据源提供的所选周期 OHLC 数据。
它的名称虽然包含 daily,但实际请求周期仍由自动或手动设置决定。
在部分品种或不同交易时段设置下,两种方式可能得到不同结果。例如,图表是否包含盘前盘后数据,会影响部分日内汇总结果。
### 六、颜色的含义
默认情况下,收盘价低于开盘价使用下跌色;收盘价等于或高于开盘价使用上涨色。
默认上涨为青绿色,下跌为红色。每组的边框和填充颜色可以分别修改,也可以调整透明度,以便区分多个周期。
这些颜色说明的是对应周期的开收关系,不构成单独的趋势确认或交易信号。
### 七、使用示例
**在1分钟图上观察15分钟范围**
保留15分钟组的默认设置,即可看到1分钟价格变化处于哪个15分钟区间中,并观察这一段区间如何逐步形成。
**在3分钟或5分钟图上观察1小时范围**
保留1小时组的默认设置,可以把当前的小周期波动放到1小时背景中理解,例如观察价格接近该小时高点、低点,还是处于范围内部。
**在15分钟和1小时图上显示4小时范围**
将4小时组的“显示图表周期”设置为 `15,60`,即可只在这两个图表周期显示4小时框。
**叠加更大周期背景**
根据需要保留周线和日线/自动周期组。多个区间重叠时,可以降低背景框的填充不透明度,减少对当前K线的遮挡。
这些用法主要帮助整理图表、对照周期和复盘区间形成过程,脚本本身没有自动买卖提醒或下单功能。
### 八、实时更新与使用限制
**当前周期的框会变化。**
所选周期尚未结束时,最高价、最低价、收盘价和涨跌颜色仍可能变化。当前显示的范围不能提前当作该周期的最终结果。
**历史完整框是对已经发生的行情进行汇总。**
在普通高低区间和 True Range 的绘制流程中,脚本在下一周期开始时绘制刚结束周期的完整框,并将其覆盖到对应的历史区间上。
因此,历史图上看到的最终框,不代表在该周期刚开始时,就已经知道后面会出现的最高价和最低价。
**新周期第一根图表K线上,当前框暂不显示。**
在较小图表周期叠加较大框周期的正常用法下,进入该周期后续图表K线时,当前框才开始显示。框的右侧更新到当前图表位置,不提前延伸至整个周期结束。
**Heikin Ashi 模式需要注意周期切换时的数据对齐。**
周线、4小时、1小时和15分钟组中的 Heikin Ashi 范围采用独立的数据请求。在周期切换附近,实时更新与重新加载后的历史显示可能存在差异,不宜把尚在变化的数据作为已经固定的确认价位。
**所有组共同使用绘图数量上限。**
整个指标最多保留500个框对象,并非每组各保留500个。日线组的 OHLC 模式每个周期需要两个框,因此显示组数和计算模式会影响可保留的历史长度。
**优先采用小周期图表观察大周期范围。**
建议将框的计算周期设为高于当前图表周期。相同周期或更低周期的组合,可能出现框宽度很窄或信息不完整的情况;该脚本不会在一根大周期K线内部还原所有小周期K线。
**数据和图形定位限制仍然适用。**
极小图表周期叠加很长的框周期,可能受到可用历史数据和图形定位范围的限制。不同数据源、交易时段设置及数据修订,也可能影响区间显示。
本指标的当前周期显示是动态的,不应将其理解为所有图形一旦出现就永不改变,也不能根据历史完整区间框推导实际交易收益。
### 九、来源说明与本版本的整合目的
本指标中的日线/自动周期模块基于 TradingView 内置的 Multi-Time Period Charts 指标进行适配。
本版本将多组周期区间集中到一个叠加指标中,并为每组提供独立的周期设置、配色设置和图表周期可见性控制。
这种组合的用途,是让较大周期背景与较小周期细节能够在同一张图中配合观察,并通过不同图表周期下的显示规则,控制重叠和遮挡。
基础区间计算采用 OHLC、True Range 和 Heikin Ashi 等常见方法;本版本侧重多组区间的组织、配置与显示管理。
リリースノート
增加了30分钟的时间框架
免責事項
これらの情報および投稿は、TradingViewが提供または承認する金融、投資、取引、またはその他の種類の助言もしくは推奨であることを意図したものではなく、またこれらに該当するものでもありません。詳細は利用規約をご覧ください。
免責事項
これらの情報および投稿は、TradingViewが提供または承認する金融、投資、取引、またはその他の種類の助言もしくは推奨であることを意図したものではなく、またこれらに該当するものでもありません。詳細は利用規約をご覧ください。