OPEN-SOURCE SCRIPT
Ultimate Robust VP Scorecard HUD
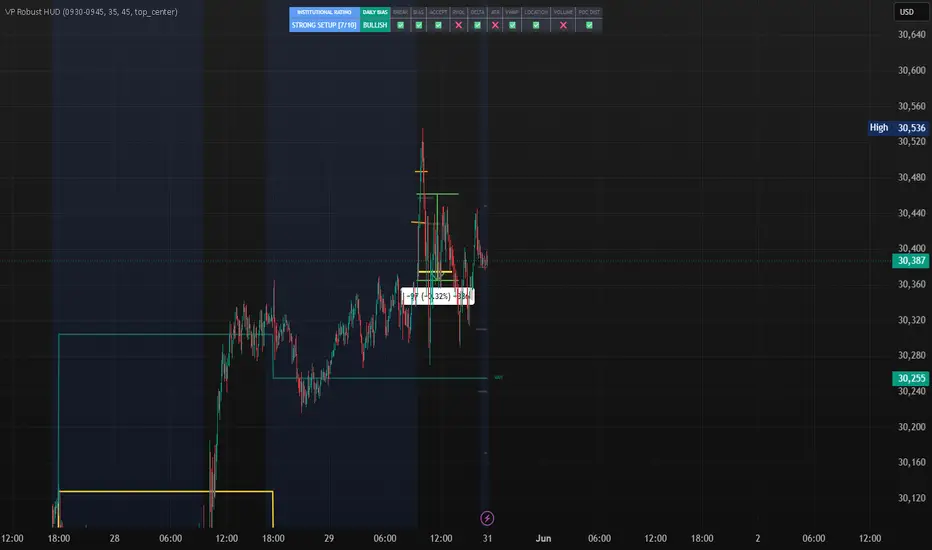
VOLUME PROFILE BIAS DASHBOARD STRATEGY
CORE PHILOSOPHY
The strategy answers three questions:
1. DIRECTION (MACRO BIAS)
Determine the overall market bias using the 5-Day Volume Profile.
Rules:
• Price Above 5-Day VAH = Bullish Macro Bias
• Price At or Near 5-Day POC = Neutral Macro Bias
• Price Below 5-Day VAL = Bearish Macro Bias
The 5-Day Profile shows where value has been accepted over the last week.
Highest conviction occurs when Macro Bias and Session Bias agree.
--------------------------------------------------
2. SESSION CONTEXT (DAILY BIAS)
Determine the session bias using yesterday's volume profile.
Rules:
• Today's Open Above Yesterday VAH = Bullish Session Bias
• Today's Open Inside Yesterday Value Area = Neutral Session Bias
• Today's Open Below Yesterday VAL = Bearish Session Bias
Interpretation:
• Above VAH = Buyers accepted higher prices
• Inside Value = Balance / Chop
• Below VAL = Sellers accepted lower prices
--------------------------------------------------
3. LOCATION (KEY LEVELS)
Automatically calculate and display:
• Previous Session VAH
• Previous Session VAL
• Previous Session POC
• 5-Day VAH
• 5-Day VAL
• 5-Day POC
• HVNs (High Volume Nodes)
• LVNs (Low Volume Nodes)
• Hidden Bumps
These become the reaction zones and profit targets.
==================================================
DASHBOARD SCORECARD
Display in the top-right corner.
Bias Score (1 Point Each)
✅ Price Above 5-Day VAH
✅ Open Above Yesterday VAH
✅ Current Price Above Yesterday VAH
✅ Acceptance Outside Value Area
✅ Relative Volume Above Average
Total Score:
5/5 = A+ Bullish
4/5 = Strong Bullish
3/5 = Neutral
2/5 = Weak
0-1/5 = Bearish
Reverse the logic for bearish conditions.
==================================================
DASHBOARD DISPLAY
Macro Context:
• Bullish
• Neutral
• Bearish
Session Context:
• Bullish
• Neutral
• Bearish
Open Location:
• Above VAH
• Inside Value
• Below VAL
Current Location:
• Above VAH
• Inside Value
• Below VAL
Acceptance Status:
• Accepted Above Value
• Accepted Below Value
• Inside Value
Relative Volume:
• Strong
• Average
• Weak
Overall Bias Score:
• 0-5
Trade Rating:
• A+
• Strong
• Neutral
• Weak
• Bearish
==================================================
LONG SETUP
Requirements:
Macro:
✅ Price Above 5-Day VAH
Session:
✅ Open Above Yesterday VAH
Trigger:
✅ Pullback Holds VAH
Entry:
• Buy Acceptance Above VAH
Stop:
• Below VAH
Targets:
• Next HVN
• Next Hidden Bump
• Next VAH
• Major Volume Node
==================================================
SHORT SETUP
Requirements:
Macro:
✅ Price Below 5-Day VAL
Session:
✅ Open Below Yesterday VAL
Trigger:
✅ Retest Fails Below VAL
Entry:
• Sell Acceptance Below VAL
Stop:
• Above VAL
Targets:
• Next LVN
• Next Hidden Bump
• Next VAL
• Major Volume Node
==================================================
NO TRADE CONDITIONS
Avoid trading when:
❌ Open Inside Value Area
❌ Current Price Inside Value Area
❌ Macro Bias and Session Bias Disagree
❌ Relative Volume Is Weak
❌ Acceptance Is Not Confirmed
Display:
"NO TRADE - INSIDE VALUE"
or
"NO TRADE - CONFLICTING BIAS"
==================================================
IMPORTANT CONCEPTS
Value Area
• Area containing approximately 70% of the session's volume.
VAH (Value Area High)
• Upper edge of accepted value.
VAL (Value Area Low)
• Lower edge of accepted value.
POC (Point of Control)
• Price level with the highest volume traded.
• Acts as the market's center of gravity.
HVN (High Volume Node)
• Price area where the market accepted value.
• Often acts as support or resistance.
LVN (Low Volume Node)
• Price area where little volume traded.
• Price often moves quickly through these zones.
Hidden Bumps
• Aggressive institutional positioning zones inside thin profiles.
• Often create strong reactions.
==================================================
TRADING LOGIC
The strategy only answers three questions:
1. Direction
• Bullish
• Bearish
• Neutral
2. Location
• VAH
• VAL
• POC
• HVN
• LVN
• Hidden Bump
3. Trigger
• Acceptance Above Value
• Acceptance Below Value
• Pullback Hold
• Retest Failure
Everything else is noise.
==================================================
ULTIMATE GOAL
Create a Volume Profile Bias Dashboard that automatically identifies:
• 5-Day Macro Bias
• Daily Session Bias
• Opening Location
• Acceptance Outside Value
• HVNs
• LVNs
• Hidden Bumps
• Key Targets
Then generate:
• Bullish Trade Opportunities
• Bearish Trade Opportunities
• No Trade Conditions
The objective is to determine whether the market is accepting higher value, lower value, or remaining balanced before executing a trade.
オープンソーススクリプト
TradingViewの精神に則り、このスクリプトの作者はコードをオープンソースとして公開してくれました。トレーダーが内容を確認・検証できるようにという配慮です。作者に拍手を送りましょう!無料で利用できますが、コードの再公開はハウスルールに従う必要があります。

免責事項
これらの情報および投稿は、TradingViewが提供または承認する金融、投資、取引、またはその他の種類の助言もしくは推奨であることを意図したものではなく、またこれらに該当するものでもありません。詳細は利用規約をご覧ください。
オープンソーススクリプト
TradingViewの精神に則り、このスクリプトの作者はコードをオープンソースとして公開してくれました。トレーダーが内容を確認・検証できるようにという配慮です。作者に拍手を送りましょう!無料で利用できますが、コードの再公開はハウスルールに従う必要があります。
免責事項
これらの情報および投稿は、TradingViewが提供または承認する金融、投資、取引、またはその他の種類の助言もしくは推奨であることを意図したものではなく、またこれらに該当するものでもありません。詳細は利用規約をご覧ください。