OPEN-SOURCE SCRIPT
MudHome - HTF Last X Candles (Range + Live Price Label)
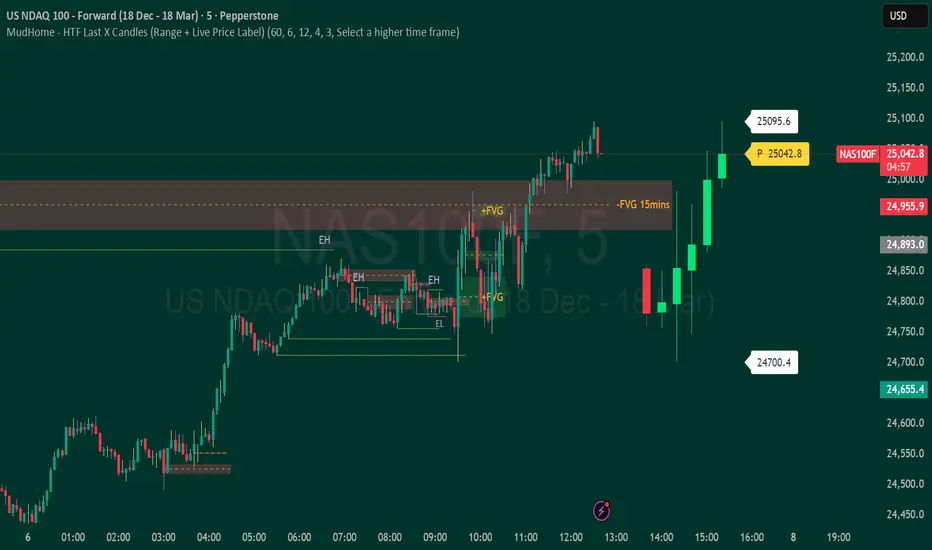
This indicator provides a live Higher Timeframe (HTF) context overlay on lower-timeframe charts by displaying the most recent HTF candles as a compact inset, alongside a dynamically updating price range.
It plots the last N HTF candles (up to 10), including the currently forming HTF candle, arranged left-to-right in standard chart order. This allows traders to visually track HTF structure, expansion, and volatility in real time while executing on lower timeframes.
Key Features
Displays the most recent HTF candles, including the live, still-forming candle
Candles are drawn to the right of price, preserving chart clarity
Automatically calculates and displays the HTF range high and low across the selected candles
Range labels update dynamically as the current HTF candle expands
Shows a live current-price label, updating tick-by-tick
Clean, minimal presentation — no cluttered OHLC labels
Fully configurable candle spacing, body width, colors, and offsets
Smart Validation
The indicator only renders when the selected timeframe is higher than the chart timeframe
If not, a clear prompt is shown: “Select a higher time frame”
Ideal Use Cases
HTF bias and context on LTF execution charts
Range expansion and contraction analysis
ICT-style dealing range, premium/discount framing
Session and structure awareness without switching timeframes
This tool is designed to act as a live HTF context box, keeping higher-timeframe structure visible at all times while you focus on execution.
It plots the last N HTF candles (up to 10), including the currently forming HTF candle, arranged left-to-right in standard chart order. This allows traders to visually track HTF structure, expansion, and volatility in real time while executing on lower timeframes.
Key Features
Displays the most recent HTF candles, including the live, still-forming candle
Candles are drawn to the right of price, preserving chart clarity
Automatically calculates and displays the HTF range high and low across the selected candles
Range labels update dynamically as the current HTF candle expands
Shows a live current-price label, updating tick-by-tick
Clean, minimal presentation — no cluttered OHLC labels
Fully configurable candle spacing, body width, colors, and offsets
Smart Validation
The indicator only renders when the selected timeframe is higher than the chart timeframe
If not, a clear prompt is shown: “Select a higher time frame”
Ideal Use Cases
HTF bias and context on LTF execution charts
Range expansion and contraction analysis
ICT-style dealing range, premium/discount framing
Session and structure awareness without switching timeframes
This tool is designed to act as a live HTF context box, keeping higher-timeframe structure visible at all times while you focus on execution.
オープンソーススクリプト
TradingViewの精神に則り、このスクリプトの作者はコードをオープンソースとして公開してくれました。トレーダーが内容を確認・検証できるようにという配慮です。作者に拍手を送りましょう!無料で利用できますが、コードの再公開はハウスルールに従う必要があります。

免責事項
これらの情報および投稿は、TradingViewが提供または承認する金融、投資、取引、またはその他の種類の助言もしくは推奨であることを意図したものではなく、またこれらに該当するものでもありません。詳細は利用規約をご覧ください。
オープンソーススクリプト
TradingViewの精神に則り、このスクリプトの作者はコードをオープンソースとして公開してくれました。トレーダーが内容を確認・検証できるようにという配慮です。作者に拍手を送りましょう!無料で利用できますが、コードの再公開はハウスルールに従う必要があります。
免責事項
これらの情報および投稿は、TradingViewが提供または承認する金融、投資、取引、またはその他の種類の助言もしくは推奨であることを意図したものではなく、またこれらに該当するものでもありません。詳細は利用規約をご覧ください。