OPEN-SOURCE SCRIPT
Trading Sessions + IB [midst]
What It Does
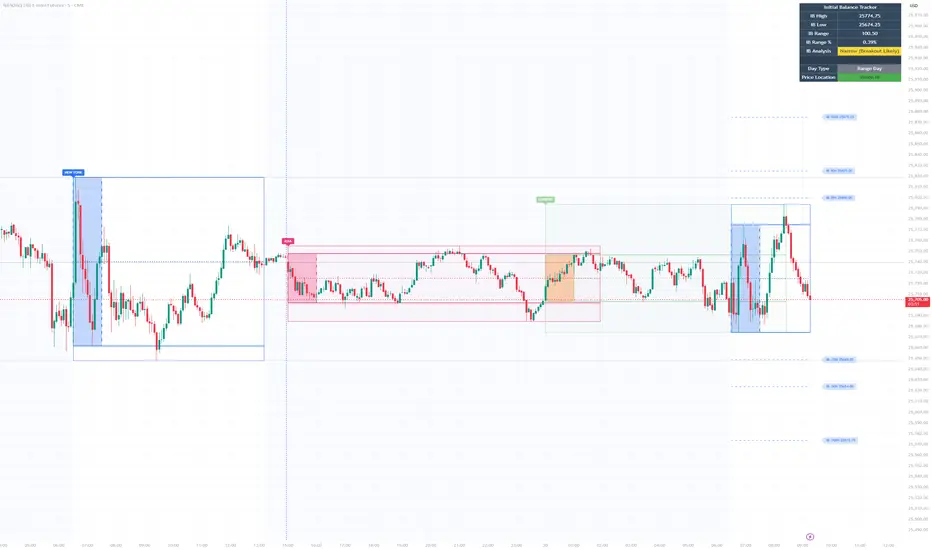
Displays the three major global trading sessions (Asia, London, New York) with Initial Balance (IB) ranges and extension levels. Automatically detects instrument type (ES, NQ, Gold, Silver) and applies correct IB period.
Key Features

Session Boxes: Visual high-to-low range for each session
Initial Balance: First 60 minutes of session range with IB high/mid/low lines
IB Extensions: Automatic calculation of +/-25%, 50%, 100% levels
Live IB Tracker: Real-time statistics table showing IB range, analysis, and market structure
Fully Customizable: Colors, line styles, labels, and display options
Why Use This
Identify key support/resistance levels based on session structure
Track IB breakouts for high-probability trade setups
Use extensions as profit targets or reversal zones
Compare session ranges to gauge volatility
Spot session overlaps for increased liquidity
Default Times (Chicago/Central Time)
Asia: 5:00 PM - 2:00 AM
London: 2:00 AM - 11:00 AM
New York: 7:30 AM - 4:00 PM
How To Use
Add indicator to your chart (works best on 5-15 minute timeframes)
Indicator auto-detects ES, NQ, GC, SI and applies correct 60-minute IB
Watch for price action at IB levels and extensions
Use IB Tracker table for real-time market analysis
Customization
Adjust everything: session times, IB period, colors, line styles, labels, table position. Toggle historical sessions, IB boxes, lines, extensions, and more.
Supported Instruments: ES/MES, NQ/MNQ, GC/MGC (Gold), SI (Silver) - auto-detection included
Displays the three major global trading sessions (Asia, London, New York) with Initial Balance (IB) ranges and extension levels. Automatically detects instrument type (ES, NQ, Gold, Silver) and applies correct IB period.
Key Features
Session Boxes: Visual high-to-low range for each session
Initial Balance: First 60 minutes of session range with IB high/mid/low lines
IB Extensions: Automatic calculation of +/-25%, 50%, 100% levels
Live IB Tracker: Real-time statistics table showing IB range, analysis, and market structure
Fully Customizable: Colors, line styles, labels, and display options
Why Use This
Identify key support/resistance levels based on session structure
Track IB breakouts for high-probability trade setups
Use extensions as profit targets or reversal zones
Compare session ranges to gauge volatility
Spot session overlaps for increased liquidity
Default Times (Chicago/Central Time)
Asia: 5:00 PM - 2:00 AM
London: 2:00 AM - 11:00 AM
New York: 7:30 AM - 4:00 PM
How To Use
Add indicator to your chart (works best on 5-15 minute timeframes)
Indicator auto-detects ES, NQ, GC, SI and applies correct 60-minute IB
Watch for price action at IB levels and extensions
Use IB Tracker table for real-time market analysis
Customization
Adjust everything: session times, IB period, colors, line styles, labels, table position. Toggle historical sessions, IB boxes, lines, extensions, and more.
Supported Instruments: ES/MES, NQ/MNQ, GC/MGC (Gold), SI (Silver) - auto-detection included
オープンソーススクリプト
TradingViewの精神に則り、このスクリプトの作者はコードをオープンソースとして公開してくれました。トレーダーが内容を確認・検証できるようにという配慮です。作者に拍手を送りましょう!無料で利用できますが、コードの再公開はハウスルールに従う必要があります。

免責事項
これらの情報および投稿は、TradingViewが提供または承認する金融、投資、取引、またはその他の種類の助言もしくは推奨であることを意図したものではなく、またこれらに該当するものでもありません。詳細は利用規約をご覧ください。
オープンソーススクリプト
TradingViewの精神に則り、このスクリプトの作者はコードをオープンソースとして公開してくれました。トレーダーが内容を確認・検証できるようにという配慮です。作者に拍手を送りましょう!無料で利用できますが、コードの再公開はハウスルールに従う必要があります。
免責事項
これらの情報および投稿は、TradingViewが提供または承認する金融、投資、取引、またはその他の種類の助言もしくは推奨であることを意図したものではなく、またこれらに該当するものでもありません。詳細は利用規約をご覧ください。