アップデート済
[blackcat] L2 Center Band Bollinger
Level: 2
Background
Bollinger bands are a type of price envelope developed by John Bollinger , where price envelopes define upper and lower price ranges. Bollinger Bands are envelopes that are represented with a standard deviation above and below a simple moving average of price. Because the spacing of the bands is based on the standard deviation, they adjust for fluctuations in the volatility of the underlying price.
Function
[blackcat] L2 Center Band Bollinger takes advantage of Bollinger band to detect sideways and trends. At the same time, I made an improvement and the center Bollinger line as a fast-slow-line color band. The algorithm of the color center band is composed of price and volume information, which produces gold cross and dead cross for short term long and short entries.
Key Signal
aa10 --> bollinger middle fast line
aa12 --> bollinger middle slow line
up --> upper envelope
dn --> lower envelope
Pros and Cons
Pros:
1. it can easy see the sections of trends or sideways by width of Bollinger band
2. long and short entries are disclosed
Cons:
1. Some noise is still incorporated in trends
2. due to this is un-optimized version, time frame and trading pairs need to be selected
3. Bollinger re-entry signal is not disclosed yet
Remarks
The long and short signal is compatible to nilux strategy backtest framework for sandardized backtest scheme: [NLX-L3] Backtest
Readme
In real life, I am a prolific inventor. I have successfully applied for more than 60 international and regional patents in the past 12 years. But in the past two years or so, I have tried to transfer my creativity to the development of trading strategies. Tradingview is the ideal platform for me. I am selecting and contributing some of the hundreds of scripts to publish in Tradingview community. Welcome everyone to interact with me to discuss these interesting pine scripts.
The scripts posted are categorized into 5 levels according to my efforts or manhours put into these works.
Level 1 : interesting script snippets or distinctive improvement from classic indicators or strategy. Level 1 scripts can usually appear in more complex indicators as a function module or element.
Level 2 : composite indicator/strategy. By selecting or combining several independent or dependent functions or sub indicators in proper way, the composite script exhibits a resonance phenomenon which can filter out noise or fake trading signal to enhance trading confidence level.
Level 3 : comprehensive indicator/strategy. They are simple trading systems based on my strategies. They are commonly containing several or all of entry signal, close signal, stop loss, take profit, re-entry, risk management, and position sizing techniques. Even some interesting fundamental and mass psychological aspects are incorporated.
Level 4 : script snippets or functions that do not disclose source code. Interesting element that can reveal market laws and work as raw material for indicators and strategies. If you find Level 1~2 scripts are helpful, Level 4 is a private version that took me far more efforts to develop.
Level 5 : indicator/strategy that do not disclose source code. private version of Level 3 script with my accumulated script processing skills or a large number of custom functions. I had a private function library built in past two years. Level 5 scripts use many of them to achieve private trading strategy.
Background
Bollinger bands are a type of price envelope developed by John Bollinger , where price envelopes define upper and lower price ranges. Bollinger Bands are envelopes that are represented with a standard deviation above and below a simple moving average of price. Because the spacing of the bands is based on the standard deviation, they adjust for fluctuations in the volatility of the underlying price.
Function
[blackcat] L2 Center Band Bollinger takes advantage of Bollinger band to detect sideways and trends. At the same time, I made an improvement and the center Bollinger line as a fast-slow-line color band. The algorithm of the color center band is composed of price and volume information, which produces gold cross and dead cross for short term long and short entries.
Key Signal
aa10 --> bollinger middle fast line
aa12 --> bollinger middle slow line
up --> upper envelope
dn --> lower envelope
Pros and Cons
Pros:
1. it can easy see the sections of trends or sideways by width of Bollinger band
2. long and short entries are disclosed
Cons:
1. Some noise is still incorporated in trends
2. due to this is un-optimized version, time frame and trading pairs need to be selected
3. Bollinger re-entry signal is not disclosed yet
Remarks
The long and short signal is compatible to nilux strategy backtest framework for sandardized backtest scheme: [NLX-L3] Backtest
Readme
In real life, I am a prolific inventor. I have successfully applied for more than 60 international and regional patents in the past 12 years. But in the past two years or so, I have tried to transfer my creativity to the development of trading strategies. Tradingview is the ideal platform for me. I am selecting and contributing some of the hundreds of scripts to publish in Tradingview community. Welcome everyone to interact with me to discuss these interesting pine scripts.
The scripts posted are categorized into 5 levels according to my efforts or manhours put into these works.
Level 1 : interesting script snippets or distinctive improvement from classic indicators or strategy. Level 1 scripts can usually appear in more complex indicators as a function module or element.
Level 2 : composite indicator/strategy. By selecting or combining several independent or dependent functions or sub indicators in proper way, the composite script exhibits a resonance phenomenon which can filter out noise or fake trading signal to enhance trading confidence level.
Level 3 : comprehensive indicator/strategy. They are simple trading systems based on my strategies. They are commonly containing several or all of entry signal, close signal, stop loss, take profit, re-entry, risk management, and position sizing techniques. Even some interesting fundamental and mass psychological aspects are incorporated.
Level 4 : script snippets or functions that do not disclose source code. Interesting element that can reveal market laws and work as raw material for indicators and strategies. If you find Level 1~2 scripts are helpful, Level 4 is a private version that took me far more efforts to develop.
Level 5 : indicator/strategy that do not disclose source code. private version of Level 3 script with my accumulated script processing skills or a large number of custom functions. I had a private function library built in past two years. Level 5 scripts use many of them to achieve private trading strategy.
リリースノート
Add backtest scheme for this indicator.After a simple tuning on SL&TP, I found this indicator works on long much better than short, which indicate short scheme need improvements.
So, in the backtest, only long direction is demostrated. You can choose "long", "short" and "both" directions in strategy backtest settings.
#########################################################################################################
Courtesy of nilux "NLX-L3 Backtest" easy backtest framework for dummies.
Step by step backtest guide with "NLX-L3 Backtest" framework:
STEP1: Add this indicator into your chart
STEP2: Add "NLX-L3 Backtest" into your chart
STEP3: Click "Settings" gear icon of "NLX-L3 Backtest" to select "Select L2 Indicator" in the 1st line as "blackcat L2 Center Band Bollinger: backtest"
STEP4: Configure your backtest other settings under "NLX-L3 Backtest" framework
STEP5: Click "OK" and view the results in "Strategy Tester" tab
リリースノート
b]OVERVIEWThe [blackcat] L2 Center Band Bollinger script calculates and plots custom Bollinger Bands using a unique approach centered around the average of four different simple moving averages. It also includes weighted moving averages, saturation calculations, and RSI-based entry signals. The script provides visual indicators for potential buy and sell points on the chart.
FEATURES
Custom Bollinger Bands: Calculated using the average of SMAs over periods of 3, 6, 12, and 24.
Weighted Moving Averages: Utilized to smooth price data for more accurate trend identification.
Saturation Calculation: Helps determine market conditions based on trading activity and price levels.
RSI-Based Entries: Provides additional entry signals based on Relative Strength Index (RSI).
Buy/Sell Labels: Automatically places buy/sell labels on the chart at identified entry points.
HOW TO USE
Copy the script code into the Pine Script editor within TradingView.
Click on "Add to Chart" to apply the indicator to your desired chart.
Observe the plotted Bollinger Bands, center bands, and labeled buy/sell signals for analysis.
Adjust parameters like lengths and multipliers if needed to better fit specific market conditions.
LIMITATIONS
The script relies heavily on historical data accuracy and may require parameter tuning for optimal performance across different markets.
Signal reliability can be affected by sudden market volatility or unusual trading patterns.
NOTES
This script was developed to enhance trading strategies by providing comprehensive visualization tools.
Users should conduct thorough backtesting before relying solely on these signals for real-time trading decisions.
リリースノート
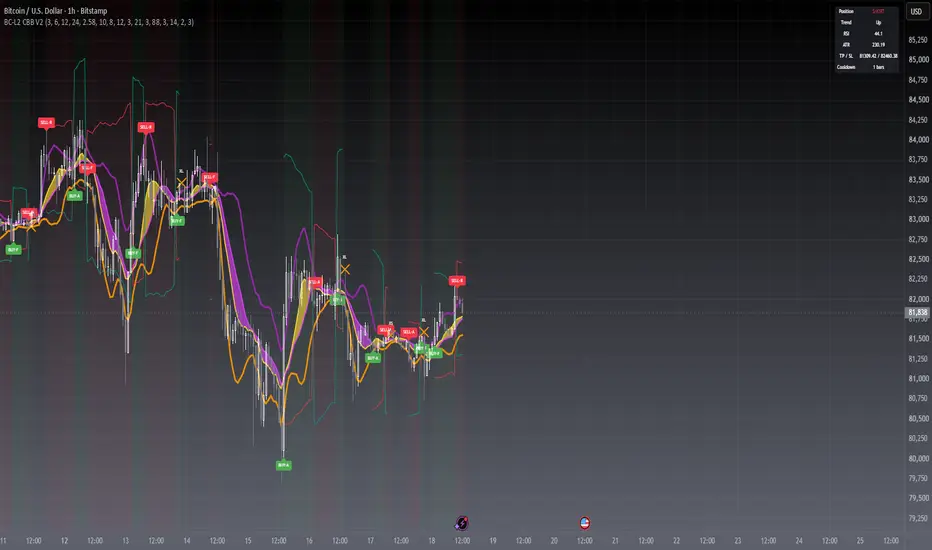
█ OVERVIEWL2 Center Band Bollinger V2 plots Bollinger-style bands around the classic BBI multi-SMA average, with dual center lines for trend direction. It marks confirmed BUY/SELL entries, reverse-signal exits, ATR-based take-profit and stop-loss reference levels, and ships with alerts plus a live status dashboard.
█ CONCEPTS
This indicator combines a volatility envelope with a dual-moving-average trend core:
• BBI Bands: an average of four SMA lengths (3/6/12/24) wrapped in bands set by a standard-deviation multiplier, giving a adaptive volatility channel.
• Dual Center Lines: a fast SMA(8) and slow SMA(12) pair whose crossings confirm short-term momentum; the fill color reflects which line leads.
• Trend Trigger: a fast EMA(3) crossing a slow EMA(21) as the primary momentum trigger.
• Weighted RSI: a custom smoothed RSI whose drop back below an overbought threshold (default 88) can trigger short signals.
█ HOW TO USE
1 — Add the indicator to your chart; it runs on the price panel with defaults matching the original V1 behavior.
2 — Tune the Bollinger Bands, Center Lines and Signals groups to your symbol and timeframe.
3 — Read BUY/SELL labels as confirmed entries, XL/XS crosses as exits, and use the plotted TP/SL lines as risk reference levels.
4 — Create alerts from "Long Entry Alert", "Short Entry Alert", "Long Exit Alert" or "Short Exit Alert" for hands-free monitoring.
Input Parameters
• Bollinger Bands: four BBI SMA lengths (3/6/12/24), band multiplier (2.58) and stdev length (10).
• Center Lines: fast SMA length (8), slow SMA length (12), fast EMA length (3), slow EMA length (21), weighted RSI length (3).
• Signals: enable/disable long and short sides, mirror short trigger (fast EMA crossunder), RSI overbought short trigger (level 88).
• Signal Governance: same-bar entry/exit exclusivity (on) and cooldown bars between signals (3, 0 = off).
• Risk (TP/SL): show TP/SL levels (on), ATR length (14), stop-loss multiplier (2.0 xATR), take-profit multiplier (3.0 xATR).
• Visual: toggles for bands, center lines, labels, position background and dashboard.
█ FEATURES
• Bidirectional signals: BUY and SELL entries with per-trigger reason codes (F = EMA cross, A = center-line cross, R = RSI overbought rejection).
• Signal governance: a position state machine with same-bar exclusivity and a configurable cooldown to suppress whipsaw clusters.
• Risk reference: ATR-scaled stop-loss (red) and take-profit (teal) lines projected from each entry.
• Position awareness: background tint (green = long, red = short) plus a dashboard with position, trend, RSI, ATR, TP/SL and cooldown status.
• Alert support: four alertcondition channels and dynamic alert() messages fired once per confirmed bar close.
• Every layer is toggleable, so the script can degrade gracefully to the original V1 signal set.
█ SIGNALS
Visual Elements
• BUY·F / BUY·A label below bar: long entry from fast-EMA crossover or center-line crossover.
• SELL·R / SELL·F / SELL·A label above bar: short entry from RSI overbought rejection, fast-EMA crossunder or center-line crossunder.
• XL / XS orange cross: long exit / short exit on the opposite crossover (reverse-signal exit).
• Green/red background: current simulated position direction.
• Red and teal broken lines: stop-loss and take-profit reference levels for the active position.
█ IMPLEMENTATION NOTES
• Built-ins used: ta.sma, ta.ema, ta.stdev, ta.atr, ta.crossover, ta.crossunder.
• All stateful ta.* calls execute unconditionally in the global scope, so internal histories stay consistent.
• Entries are edge-triggered crossovers evaluated on confirmed bars; alert() calls use alert.freq_once_per_bar_close to avoid intrabar repaint alerts.
• No request.security calls: everything computes on the chart timeframe, so there is no higher-timeframe lookahead risk.
• TP/SL lines are plotted references for manual or strategy-side execution; this is an indicator, not an auto-trading strategy.
█ LIMITATIONS
• Best suited for trending markets; ranging conditions can still produce whipsaw entries despite the cooldown.
• Short signals partly rely on RSI overbought rejection, which fires less often than the mirrored EMA trigger; disable either trigger to fit your style.
• Weighted RSI uses a recursive smoother and returns a neutral 50 on division-free bars (e.g. flat closes) instead of an error.
• Not recommended as a standalone system: combine with higher-timeframe context and your own risk management.
█ NOTES
• V2 polish of the original open-source L2 Center Band Bollinger: migrated to Pine v6, dead code removed, all parameters exposed as grouped inputs, exits, risk levels, governance, visuals and alerts added.
• Original V1 trigger conditions are preserved verbatim; every addition is behind an input switch with V1-compatible defaults.
═════════════════════════════════════════════════════════════════════════
For questions or feedback, use comments section below.
Feel free to use and modify — attribution appreciated.

Don't miss out! The first and most important thing to do is to join my Discord chat now! Click here to start your adventure: discord.com/invite/ZTGpQJq My new github for more pine development soon: github.com/wxt-coder
免責事項
これらの情報および投稿は、TradingViewが提供または承認する金融、投資、取引、またはその他の種類の助言もしくは推奨であることを意図したものではなく、またこれらに該当するものでもありません。詳細は利用規約をご覧ください。
Don't miss out! The first and most important thing to do is to join my Discord chat now! Click here to start your adventure: discord.com/invite/ZTGpQJq My new github for more pine development soon: github.com/wxt-coder
免責事項
これらの情報および投稿は、TradingViewが提供または承認する金融、投資、取引、またはその他の種類の助言もしくは推奨であることを意図したものではなく、またこれらに該当するものでもありません。詳細は利用規約をご覧ください。