OPEN-SOURCE SCRIPT
Commodity Markets Dashboard with Cheat Sheet
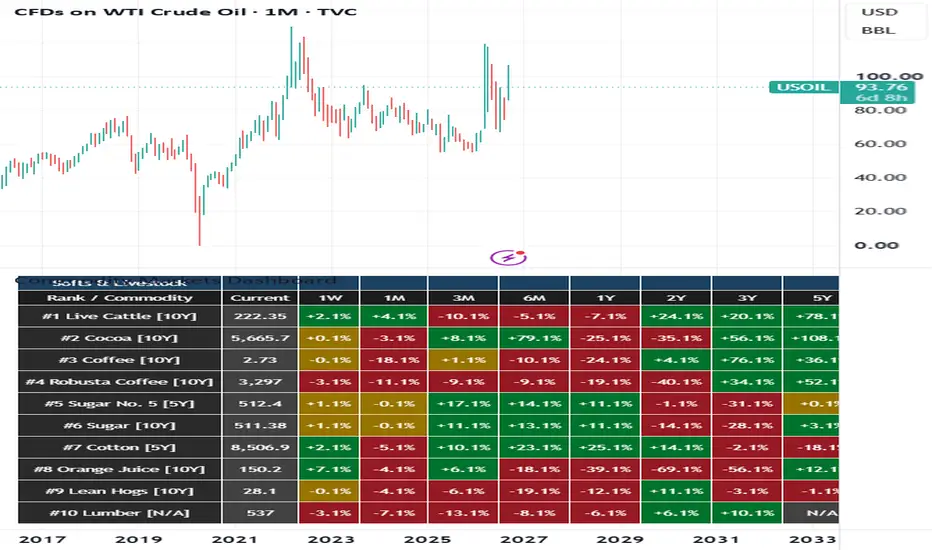
Commodity Markets Dashboard with Cheat Sheet
This indicator is a multi-market commodity dashboard designed to compare major commodity groups across short-, medium- and long-term time horizons.
It organises markets into six pages:
Commodity Indices
Energy
Metals
Grains & Oilseeds
Softs & Livestock
Real Commodity / CPI
The dashboard ranks instruments from strongest to weakest using 10-year performance where available. If a valid 10-year value is not available, it falls back to 5-year performance. The ranking basis is shown next to each instrument as [10Y] or [5Y].
For example:
#1 Gold [10Y]
#2 Copper [10Y]
#3 Iron [5Y]
This makes it possible to include newer data series while still keeping the table ranked.
What the dashboard shows
The Full view contains:
Current
1 Week
1 Month
3 Months
6 Months
1 Year
2 Years
3 Years
5 Years
10 Years
21-Day Z-Score
30-Week High Distance
200-Week Moving Average Distance
Cheat Sheet
There are also two reduced views:
Momentum focuses on shorter-term performance, the Z-score, distance from the 30-week high and position relative to the 200-week moving average.
Long Term concentrates on 1-year, 2-year, 3-year, 5-year and 10-year performance together with the 200-week moving average.
Colour interpretation
Green indicates positive performance or a market trading above its long-term trend.
Red indicates negative performance or a market trading below its long-term trend.
Yellow represents approximately unchanged performance based on the user-defined neutral band.
Orange is used when the 21-day Z-score indicates a relatively stretched move.
Blue is used for structural/reference information.
Grey is used for current values, neutral information and unavailable data.
Colours are intended as a visual aid only and are not automatic buy or sell signals.
21-Day Z-Score
The 21-day Z-score measures how far the current price is from its 21-day average in standard-deviation terms.
A reading around:
0 Near its recent average
+1 Moderately above average
-1 Moderately below average
+2 Strong positive extension
-2 Strong negative extension
+3/-3 Very unusual short-term move
The Z-score should be interpreted as a measure of statistical extension, not by itself as a reversal signal.
A strongly positive Z-score can occur in a powerful uptrend, while a strongly negative Z-score can occur during persistent weakness.
30-Week High
The dashboard shows the percentage distance from the highest price reached over approximately 30 weeks.
Examples:
0% At or very near the 30-week high
-5% 5% below the 30-week high
-20% 20% below the 30-week high
A value close to zero generally indicates strong intermediate-term positioning, while a deeply negative value indicates that the instrument has moved significantly away from its recent high.
200-Week Moving Average
The 200-week moving average is used as a long-term trend reference.
Examples:
+25% Price is 25% above its 200-week moving average
0% Price is close to its 200-week moving average
-20% Price is 20% below its 200-week moving average
This can help distinguish a short-term rally from a market that is also strong on a much longer-term basis.
Commodity Indices
This page provides a broad overview of the commodity complex using major benchmark indices.
It is useful for identifying whether strength or weakness is concentrated in an individual commodity or is part of a broader commodity-market move.
Energy
The Energy page includes major oil, refined-product, natural-gas and carbon markets.
Examples include:
WTI Crude
Brent Crude
Heating Oil
Gasoil
Gasoline
Henry Hub Natural Gas
Dutch TTF Gas
UK NBP Gas
Carbon
Energy markets can be influenced by supply, inventories, weather, refining capacity, geopolitical events and global demand.
Metals
The Metals page includes precious and industrial metals such as:
Gold
Silver
Platinum
Palladium
Copper
Aluminium
Iron
Zinc
Lead
Nickel
TSI
Precious metals can be sensitive to currencies, interest rates and investment demand, while industrial metals are often more closely linked to manufacturing, construction and global economic activity.
Copper and iron are particularly useful as cyclical indicators because of their importance in construction and industrial production.
Grains & Oilseeds
This section covers major agricultural markets including:
Wheat
Corn
Soybeans
Soybean Meal
Soybean Oil
Oats
Rough Rice
European Wheat
Agricultural commodities can be highly sensitive to weather, harvest conditions, inventories, trade policy and regional production shocks.
Softs & Livestock
This page includes markets such as:
Cocoa
Coffee
Robusta Coffee
Sugar
Cotton
Orange Juice
Live Cattle
Lean Hogs
Lumber
Many of these markets can experience substantial supply-driven volatility because production is sensitive to weather, disease, crop cycles, herd cycles or geographically concentrated supply.
Real Commodity / CPI
This page divides selected asset prices by the U.S. Consumer Price Index.
Examples include:
Gold / CPI
Silver / CPI
WTI / CPI
Copper / CPI
Bitcoin / CPI
Ethereum / CPI
XRP / CPI
These ratios are designed to show how an asset has performed relative to consumer-price inflation.
If a ratio is rising, the asset has been appreciating faster than the CPI measure over that period.
If a ratio is falling, the asset has been underperforming CPI.
These are relative-price ratios and should not be interpreted as a precise measure of an investor's personal purchasing power.
Ranking methodology
The dashboard sorts each page from strongest to weakest.
The ranking rule is:
1. Use 10-year return where available
2. If 10-year data is unavailable, use 5-year return
3. If neither exists, place the instrument at the bottom
The ranking basis is displayed alongside the commodity name.
This means that two instruments may occasionally be ranked using different historical periods. The [10Y] and [5Y] labels are included specifically so this is visible to the user.
Data availability
Some TradingView feeds have significantly longer histories than others.
For this reason:
Some instruments may show N/A for longer periods.
A 10-year figure requires sufficient historical data from the selected TradingView feed.
Continuous futures, CFDs, spot markets and exchange-traded instruments can have different historical construction methods.
Results from different providers may not be perfectly comparable.
The script uses ignore_invalid_symbol=true, so an unavailable symbol should normally display unavailable data rather than intentionally stopping the entire dashboard.
How to use the dashboard
The dashboard is most useful for looking for agreement across several horizons.
For example, an instrument displaying:
1M positive
3M positive
1Y positive
5Y positive
10Y positive
200W positive
is showing strength across several different time horizons.
By contrast:
1M positive
3M positive
5Y negative
10Y negative
200W negative
may indicate a shorter-term recovery occurring inside a weaker long-term trend.
The dashboard is intended to help users see these differences quickly rather than relying on any single metric.
Important note
This indicator is an analytical dashboard, not an investment recommendation or automated trading system.
Long-term returns, moving averages, Z-scores and relative CPI ratios are descriptive measures. They should be considered together with liquidity, fundamentals, macroeconomic conditions, market structure and the characteristics of the underlying TradingView data feed.
オープンソーススクリプト
TradingViewの精神に則り、このスクリプトの作者はコードをオープンソースとして公開してくれました。トレーダーが内容を確認・検証できるようにという配慮です。作者に拍手を送りましょう!無料で利用できますが、コードの再公開はハウスルールに従う必要があります。

免責事項
これらの情報および投稿は、TradingViewが提供または承認する金融、投資、取引、またはその他の種類の助言もしくは推奨であることを意図したものではなく、またこれらに該当するものでもありません。詳細は利用規約をご覧ください。
オープンソーススクリプト
TradingViewの精神に則り、このスクリプトの作者はコードをオープンソースとして公開してくれました。トレーダーが内容を確認・検証できるようにという配慮です。作者に拍手を送りましょう!無料で利用できますが、コードの再公開はハウスルールに従う必要があります。
免責事項
これらの情報および投稿は、TradingViewが提供または承認する金融、投資、取引、またはその他の種類の助言もしくは推奨であることを意図したものではなく、またこれらに該当するものでもありません。詳細は利用規約をご覧ください。