OPEN-SOURCE SCRIPT
更新済 Footprint Master Pane [ZynAlgo]
Overview
ZynAlgo Footprint Master Pane is an order-flow and footprint-style volume analysis indicator designed to help traders study micro-liquidity behavior inside each candlestick.
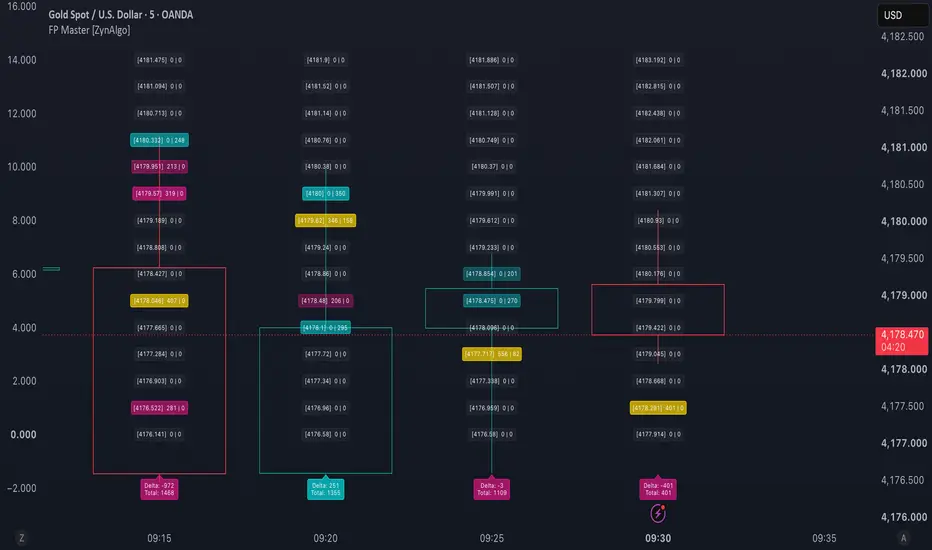
The tool displays intrabar volume-side activity as a matrix-style Footprint Profile in a separate pane. Instead of only observing open, high, low, and close movement, traders can study where buying and selling pressure appears across different price levels inside recent candles.
This can help users evaluate:
Chart example:

How to Read the Footprint Matrix
Each data block on the chart is displayed in this format:
[Price Level] Bid | Ask
Price Level
The price level represented by that row of the footprint matrix.
Bid - Left Number
Represents sell-side volume activity classified by the script for that price level.
Ask - Right Number
Represents buy-side volume activity classified by the script for that price level.
Background Color - Heatmap
The higher the volume at a price level, the stronger the heatmap intensity.
Default color logic:
Key Highlights
POC - Point of Control
The Point of Control is the price level with the highest total trading volume within the selected candlestick.
It is displayed as the gold zone and represents the main volume concentration area for that candle.
Footer Metrics
The bottom of each footprint column displays summary data for the candle.
Delta
Delta represents the net difference between buy-side and sell-side volume activity.
A positive delta indicates that buy-side pressure is dominant. A negative delta indicates that sell-side pressure is dominant.
Total Volume
Total volume represents the combined volume activity for the entire candlestick.
Configuration Settings
1. Order Flow Engine
Intrabar Timeframe
Defines the lower timeframe used by the tool to extract intrabar volume information.
Lower intrabar timeframes can provide more detailed footprint construction, while higher intrabar timeframes may produce a smoother and lighter display.
Stack Levels - Height
Controls how many price levels each candlestick is divided into.
Higher values:
Lower values:
Auto Detect Asset - Smart Grid
When enabled, the system attempts to measure the current asset's volatility and calculate an appropriate grid size automatically.
This is useful when switching between markets such as gold, crypto, forex, indices, or stocks.
Manual Tick Size
When Auto Detect Asset is disabled, users can manually define the tick or grid size.
This can be useful when a symbol requires a custom footprint scale.
2. Pane Visuals
Recent Bars to Render
Controls how many recent candles are displayed in detailed footprint form.
Limiting the number of rendered candles can help keep the chart responsive on TradingView.
Color Customization
Users can customize the colors for:
This allows the footprint pane to match different chart themes and visual preferences.
Basic Analytical Applications
1. Absorption Observation
When price approaches a key support or resistance area, footprint data can help traders study whether one side of the market is being absorbed.
For example, if a bearish candle shows positive delta and large volume near the lower part of the candle, it may suggest that sell pressure is being absorbed by buy-side participation.
2. POC Migration
Point of Control migration can help traders evaluate where value is shifting across consecutive candles.
In an uptrend, POC zones that continue to migrate higher may suggest that market participation is accepting higher prices.
3. Liquidity at Highs and Lows
Traders can inspect volume activity near candle highs and lows to study exhaustion behavior.
For example, if price reaches a new high but the top levels show very low participation, that may indicate weaker continuation pressure.
How to Use
Best Use Cases
This indicator may be useful for:
Limitations
Important Note
This indicator is an analysis tool only. It does not provide financial advice, investment advice, or guaranteed trading results. Users are responsible for their own trading decisions and risk management.
ZynAlgo Footprint Master Pane is an order-flow and footprint-style volume analysis indicator designed to help traders study micro-liquidity behavior inside each candlestick.
The tool displays intrabar volume-side activity as a matrix-style Footprint Profile in a separate pane. Instead of only observing open, high, low, and close movement, traders can study where buying and selling pressure appears across different price levels inside recent candles.
This can help users evaluate:
- Intrabar volume concentration
- Buy-side and sell-side pressure
- Delta behavior inside each candle
- Point of Control placement
- Liquidity concentration at candle highs and lows
- Potential absorption or exhaustion behavior
Chart example:
How to Read the Footprint Matrix
Each data block on the chart is displayed in this format:
[Price Level] Bid | Ask
Price Level
The price level represented by that row of the footprint matrix.
Bid - Left Number
Represents sell-side volume activity classified by the script for that price level.
Ask - Right Number
Represents buy-side volume activity classified by the script for that price level.
Background Color - Heatmap
The higher the volume at a price level, the stronger the heatmap intensity.
Default color logic:
- Cyan: buy-side activity is dominant at that price level.
- Pink: sell-side activity is dominant at that price level.
- Gray: low or inactive liquidity area.
Key Highlights
POC - Point of Control
The Point of Control is the price level with the highest total trading volume within the selected candlestick.
It is displayed as the gold zone and represents the main volume concentration area for that candle.
Footer Metrics
The bottom of each footprint column displays summary data for the candle.
Delta
Delta represents the net difference between buy-side and sell-side volume activity.
A positive delta indicates that buy-side pressure is dominant. A negative delta indicates that sell-side pressure is dominant.
Total Volume
Total volume represents the combined volume activity for the entire candlestick.
Configuration Settings
1. Order Flow Engine
Intrabar Timeframe
Defines the lower timeframe used by the tool to extract intrabar volume information.
Lower intrabar timeframes can provide more detailed footprint construction, while higher intrabar timeframes may produce a smoother and lighter display.
Stack Levels - Height
Controls how many price levels each candlestick is divided into.
Higher values:
- Show more footprint detail
- Create a finer price-level breakdown
- May increase chart processing load
Lower values:
- Create a simpler footprint view
- Reduce visual density
- May run more smoothly on slower charts
Auto Detect Asset - Smart Grid
When enabled, the system attempts to measure the current asset's volatility and calculate an appropriate grid size automatically.
This is useful when switching between markets such as gold, crypto, forex, indices, or stocks.
Manual Tick Size
When Auto Detect Asset is disabled, users can manually define the tick or grid size.
This can be useful when a symbol requires a custom footprint scale.
2. Pane Visuals
Recent Bars to Render
Controls how many recent candles are displayed in detailed footprint form.
Limiting the number of rendered candles can help keep the chart responsive on TradingView.
Color Customization
Users can customize the colors for:
- Buy-side activity
- Sell-side activity
- Point of Control zone
- Heatmap display
This allows the footprint pane to match different chart themes and visual preferences.
Basic Analytical Applications
1. Absorption Observation
When price approaches a key support or resistance area, footprint data can help traders study whether one side of the market is being absorbed.
For example, if a bearish candle shows positive delta and large volume near the lower part of the candle, it may suggest that sell pressure is being absorbed by buy-side participation.
2. POC Migration
Point of Control migration can help traders evaluate where value is shifting across consecutive candles.
In an uptrend, POC zones that continue to migrate higher may suggest that market participation is accepting higher prices.
3. Liquidity at Highs and Lows
Traders can inspect volume activity near candle highs and lows to study exhaustion behavior.
For example, if price reaches a new high but the top levels show very low participation, that may indicate weaker continuation pressure.
How to Use
- Add the indicator to the chart.
- Choose an intrabar timeframe suitable for the chart timeframe and market.
- Adjust stack levels to control footprint detail.
- Use the heatmap to identify price levels with stronger participation.
- Monitor the POC to study where volume concentration forms inside each candle.
- Compare delta and total volume to evaluate buy-side or sell-side pressure.
- Combine footprint observations with market structure, support and resistance, liquidity zones, and risk planning.
Best Use Cases
This indicator may be useful for:
- Order-flow style analysis
- Footprint chart reading
- Intrabar volume analysis
- Delta observation
- Point of Control tracking
- Absorption study
- Exhaustion analysis
- Liquidity-zone confirmation
Limitations
- Footprint values depend on the intrabar data available from TradingView for the selected symbol and timeframe.
- The Bid and Ask display is based on the script's volume-side classification logic and should be interpreted as analytical volume-side data.
- Lower intrabar timeframes may provide more detail but can increase processing load.
- A footprint imbalance does not guarantee price continuation or reversal.
- The indicator does not provide automatic trade entries, exits, or position management.
- Past order-flow or footprint behavior does not guarantee future results.
Important Note
This indicator is an analysis tool only. It does not provide financial advice, investment advice, or guaranteed trading results. Users are responsible for their own trading decisions and risk management.
リリースノート
Update Text size setting.オープンソーススクリプト
TradingViewの精神に則り、このスクリプトの作者はコードをオープンソースとして公開してくれました。トレーダーが内容を確認・検証できるようにという配慮です。作者に拍手を送りましょう!無料で利用できますが、コードの再公開はハウスルールに従う必要があります。

ZynAlgo — Automation trading tools & analysis. zynassets.com/l/cG3Ym
免責事項
これらの情報および投稿は、TradingViewが提供または承認する金融、投資、取引、またはその他の種類の助言もしくは推奨であることを意図したものではなく、またこれらに該当するものでもありません。詳細は利用規約をご覧ください。
オープンソーススクリプト
TradingViewの精神に則り、このスクリプトの作者はコードをオープンソースとして公開してくれました。トレーダーが内容を確認・検証できるようにという配慮です。作者に拍手を送りましょう!無料で利用できますが、コードの再公開はハウスルールに従う必要があります。
ZynAlgo — Automation trading tools & analysis. zynassets.com/l/cG3Ym
免責事項
これらの情報および投稿は、TradingViewが提供または承認する金融、投資、取引、またはその他の種類の助言もしくは推奨であることを意図したものではなく、またこれらに該当するものでもありません。詳細は利用規約をご覧ください。