OPEN-SOURCE SCRIPT
AK - DCA Calculator
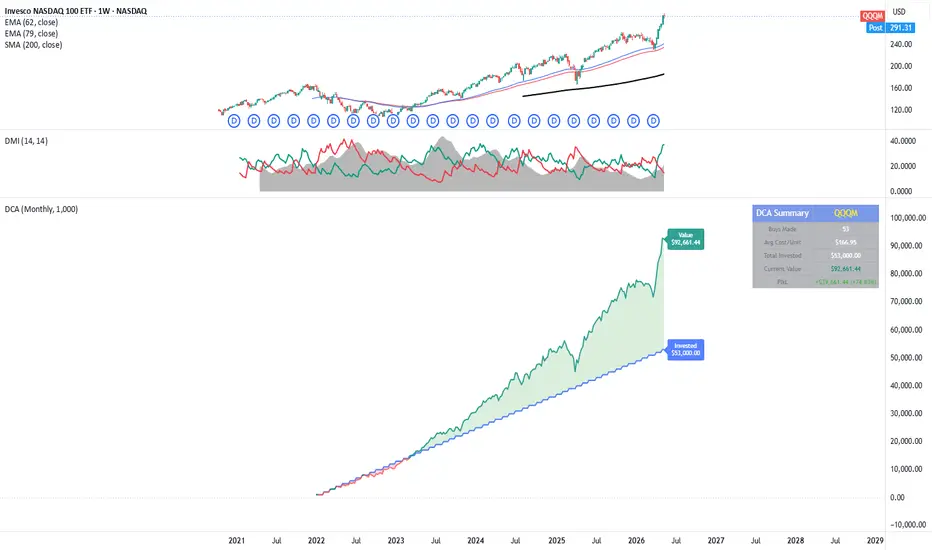
This indicator visualizes your Dollar Cost Averaging (DCA) strategy directly on your chart — no backtesting, no strategy tester, just a clean plot showing exactly where your money stands today.
What it does
Set your start date, buy frequency, and investment amount — the indicator calculates how many units you would have accumulated through consistent DCA purchases, then plots your total invested capital against your current portfolio value in a separate pane below the chart.
Features
📅 Configurable start date — model your DCA from any point in history
🔁 Three buy frequencies — Daily, Weekly, or Monthly
💵 Custom investment amount per purchase
📊 Separate pane — does not clutter your main price chart
🟢 Green fill when you're in profit, red fill when underwater
🏷️ Live labels on the last bar showing exact invested vs. current value
📋 Summary table (top-right) showing: buys made, average cost per unit, total invested, current portfolio value, and P&L in both $ and %
🎨 Fully customizable colors for all plot elements
How to use
Add the indicator to any ticker
Open Settings and set your Start Date, Buy Frequency, and Amount per Purchase
Best used on a Daily or Weekly chart for accurate frequency simulation
Works on any asset — stocks, crypto, forex, indices.
What it does
Set your start date, buy frequency, and investment amount — the indicator calculates how many units you would have accumulated through consistent DCA purchases, then plots your total invested capital against your current portfolio value in a separate pane below the chart.
Features
📅 Configurable start date — model your DCA from any point in history
🔁 Three buy frequencies — Daily, Weekly, or Monthly
💵 Custom investment amount per purchase
📊 Separate pane — does not clutter your main price chart
🟢 Green fill when you're in profit, red fill when underwater
🏷️ Live labels on the last bar showing exact invested vs. current value
📋 Summary table (top-right) showing: buys made, average cost per unit, total invested, current portfolio value, and P&L in both $ and %
🎨 Fully customizable colors for all plot elements
How to use
Add the indicator to any ticker
Open Settings and set your Start Date, Buy Frequency, and Amount per Purchase
Best used on a Daily or Weekly chart for accurate frequency simulation
Works on any asset — stocks, crypto, forex, indices.
オープンソーススクリプト
TradingViewの精神に則り、このスクリプトの作者はコードをオープンソースとして公開してくれました。トレーダーが内容を確認・検証できるようにという配慮です。作者に拍手を送りましょう!無料で利用できますが、コードの再公開はハウスルールに従う必要があります。

免責事項
これらの情報および投稿は、TradingViewが提供または承認する金融、投資、取引、またはその他の種類の助言もしくは推奨であることを意図したものではなく、またこれらに該当するものでもありません。詳細は利用規約をご覧ください。
オープンソーススクリプト
TradingViewの精神に則り、このスクリプトの作者はコードをオープンソースとして公開してくれました。トレーダーが内容を確認・検証できるようにという配慮です。作者に拍手を送りましょう!無料で利用できますが、コードの再公開はハウスルールに従う必要があります。
免責事項
これらの情報および投稿は、TradingViewが提供または承認する金融、投資、取引、またはその他の種類の助言もしくは推奨であることを意図したものではなく、またこれらに該当するものでもありません。詳細は利用規約をご覧ください。