OPEN-SOURCE SCRIPT
更新済 DVOL/(UVOL+DVOL) 5min INTRADAY
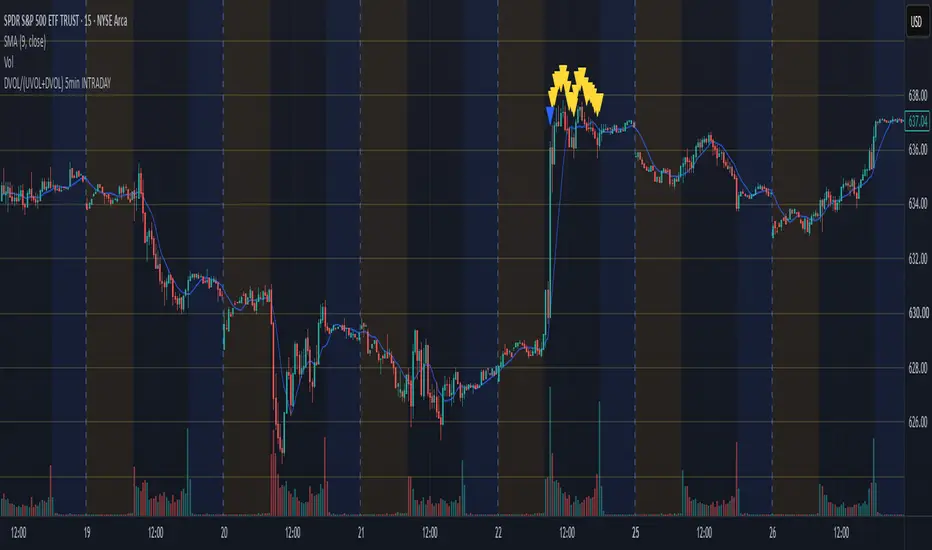
Overview:
This indicator tracks broad US market volume breadth in real-time to identify extreme intraday volume imbalances. By comparing Down Volume (USI:DVOL) against total volume (UVOL + DVOL) on a 5-minute timeframe, it pinpoints moments of aggressive market-wide buying and selling pressure that often signal intraday exhaustion points, reversals, or momentum continuation.
How It Works
The script calculates the ratio of declining volume against total market volume on every 5-minute candle:
Down Volume Ratio = DVOL / (UVOL+DVOL)
Extreme Down-Volume / Selling Pressure >= 89.9%
Triggers when down volume accounts for 89.9% or more of all traded volume across US markets. This often marks extreme panic selling or capitulation.
Extreme Up-Volume / Buying Pressure <= 9.9%
Triggers when down volume is under 10 (meaning Up Volume is 90%+).This marks broad-based market buying frenzies.
🟠 Orange Triangle (Below Bar) — Single High Threshold:
First occurrence of extreme market selling volume (≥89.9)
🟣 Purple Triangle (Below Bar) — Repeated High Threshold:
Extreme selling volume triggered when the condition has already appeared 2 or more times over the past 3 days (clustered selling pressure).
🔵 Blue Triangle (Above Bar) — Single Low Threshold:
First occurrence of extreme market buying volume (≤9.9%)
🟡 Yellow Triangle (Above Bar) — Repeated Low Threshold:
Extreme buying volume triggered when the condition has appeared 2 or more times over the past 3 days (clustered buying pressure).
Built-in Webhook & JSON Alerts
Whenever any single or repeated volume threshold is met, the indicator triggers a ready-to-use JSON alert payload (firing once per bar):
JSON:
{"text": "Trading Signal: Intraday SCALPING ONLY Short-Term trade SPY Triggered at [Price] Ticker [Ticker] Chart [Timeframe]"}
This is ideal for automated execution, Discord/Telegram webhooks, or alert routing.
This is designed specifically for SPY , SP500 indices , ES_F1! on a intraday timeframe and for intraday trading only.
This indicator tracks broad US market volume breadth in real-time to identify extreme intraday volume imbalances. By comparing Down Volume (USI:DVOL) against total volume (UVOL + DVOL) on a 5-minute timeframe, it pinpoints moments of aggressive market-wide buying and selling pressure that often signal intraday exhaustion points, reversals, or momentum continuation.
How It Works
The script calculates the ratio of declining volume against total market volume on every 5-minute candle:
Down Volume Ratio = DVOL / (UVOL+DVOL)
Extreme Down-Volume / Selling Pressure >= 89.9%
Triggers when down volume accounts for 89.9% or more of all traded volume across US markets. This often marks extreme panic selling or capitulation.
Extreme Up-Volume / Buying Pressure <= 9.9%
Triggers when down volume is under 10 (meaning Up Volume is 90%+).This marks broad-based market buying frenzies.
🟠 Orange Triangle (Below Bar) — Single High Threshold:
First occurrence of extreme market selling volume (≥89.9)
🟣 Purple Triangle (Below Bar) — Repeated High Threshold:
Extreme selling volume triggered when the condition has already appeared 2 or more times over the past 3 days (clustered selling pressure).
🔵 Blue Triangle (Above Bar) — Single Low Threshold:
First occurrence of extreme market buying volume (≤9.9%)
🟡 Yellow Triangle (Above Bar) — Repeated Low Threshold:
Extreme buying volume triggered when the condition has appeared 2 or more times over the past 3 days (clustered buying pressure).
Built-in Webhook & JSON Alerts
Whenever any single or repeated volume threshold is met, the indicator triggers a ready-to-use JSON alert payload (firing once per bar):
JSON:
{"text": "Trading Signal: Intraday SCALPING ONLY Short-Term trade SPY Triggered at [Price] Ticker [Ticker] Chart [Timeframe]"}
This is ideal for automated execution, Discord/Telegram webhooks, or alert routing.
This is designed specifically for
SPY , SP500 indices , ES_F1! on a intraday timeframe and for intraday trading only. リリースノート
Overview:This indicator tracks broad US market volume breadth in real-time to identify extreme intraday volume imbalances. By comparing Down Volume (USI:DVOL) against total volume (UVOL + DVOL) on a 5-minute timeframe, it pinpoints moments of aggressive market-wide buying and selling pressure that often signal intraday exhaustion points, reversals, or momentum continuation.
How It Works
The script calculates the ratio of declining volume against total market volume on every 5-minute candle:
Down Volume Ratio = DVOL / (UVOL+DVOL)
Extreme Down-Volume / Selling Pressure >= 89.9%
Triggers when down volume accounts for 89.9% or more of all traded volume across US markets. This often marks extreme panic selling or capitulation.
Extreme Up-Volume / Buying Pressure <= 9.9%
Triggers when down volume is under 10 (meaning Up Volume is 90%+).This marks broad-based market buying frenzies.
🟠 Orange Triangle (Below Bar) — Single High Threshold:
First occurrence of extreme market selling volume (≥89.9)
🟣 Purple Triangle (Below Bar) — Repeated High Threshold:
Extreme selling volume triggered when the condition has already appeared 2 or more times over the past 3 days (clustered selling pressure).
🔵 Blue Triangle (Above Bar) — Single Low Threshold:
First occurrence of extreme market buying volume (≤9.9%)
🟡 Yellow Triangle (Above Bar) — Repeated Low Threshold:
Extreme buying volume triggered when the condition has appeared 2 or more times over the past 3 days (clustered buying pressure).
Built-in Webhook & JSON Alerts
Whenever any single or repeated volume threshold is met, the indicator triggers a ready-to-use JSON alert payload (firing once per bar):
JSON:
{"text": "Trading Signal: Intraday SCALPING ONLY Short-Term trade SPY Triggered at [Price] Ticker [Ticker] Chart [Timeframe]"}
This is ideal for automated execution, Discord/Telegram webhooks, or alert routing.
This is designed specifically for
SPY
, SP500 indices , ES_F1! on a intraday timeframe and for intraday trading only.
リリースノート
V3 Fixed a bug where the signal triggers prematurely at the day's opening print
オープンソーススクリプト
TradingViewの精神に則り、このスクリプトの作者はコードをオープンソースとして公開してくれました。トレーダーが内容を確認・検証できるようにという配慮です。作者に拍手を送りましょう!無料で利用できますが、コードの再公開はハウスルールに従う必要があります。

免責事項
これらの情報および投稿は、TradingViewが提供または承認する金融、投資、取引、またはその他の種類の助言もしくは推奨であることを意図したものではなく、またこれらに該当するものでもありません。詳細は利用規約をご覧ください。
オープンソーススクリプト
TradingViewの精神に則り、このスクリプトの作者はコードをオープンソースとして公開してくれました。トレーダーが内容を確認・検証できるようにという配慮です。作者に拍手を送りましょう!無料で利用できますが、コードの再公開はハウスルールに従う必要があります。
免責事項
これらの情報および投稿は、TradingViewが提供または承認する金融、投資、取引、またはその他の種類の助言もしくは推奨であることを意図したものではなく、またこれらに該当するものでもありません。詳細は利用規約をご覧ください。