US02Y - DE02Y Spread
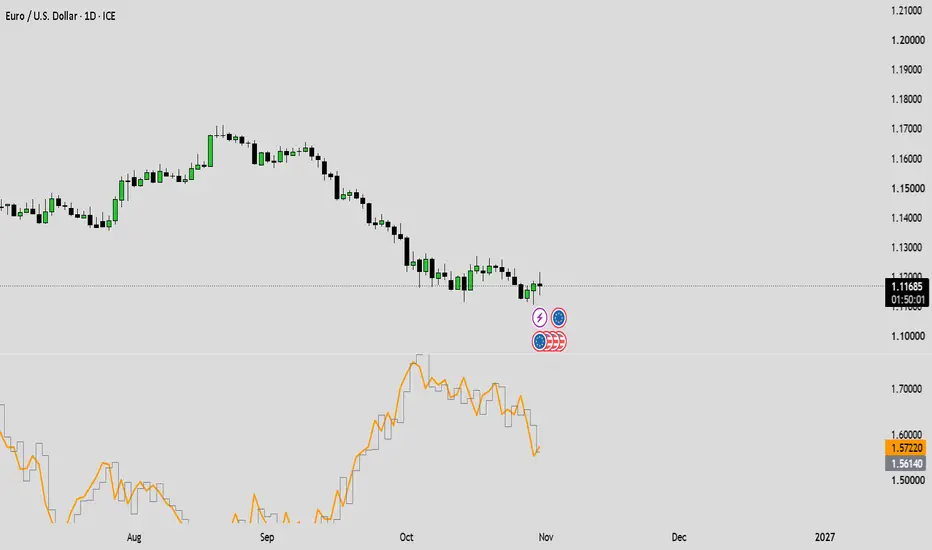
Plots the yield spread between US and German 2-year government bonds in a separate pane. The rate differential is one of the key macro drivers of EURUSD, and this indicator lets you track it on any timeframe, including intraday.
How to read:
• Rising spread → widening US yield advantage → USD-positive, bearish EURUSD
• Falling spread → narrowing advantage → EUR-positive, bullish EURUSD
• Gray step line: the daily opening spread. Above it, intraday flow favors USD; below it, EUR.
Suggested use:
• Use it as a daily bias filter, not an entry signal.
• Around high-impact events (CPI, NFP, FOMC, ECB), check whether the move in price is confirmed by yields.
• Watch for divergences between price and the spread.
Note: DE02Y intraday data is sparse outside European hours; a stepped line is expected
How to read:
• Rising spread → widening US yield advantage → USD-positive, bearish EURUSD
• Falling spread → narrowing advantage → EUR-positive, bullish EURUSD
• Gray step line: the daily opening spread. Above it, intraday flow favors USD; below it, EUR.
Suggested use:
• Use it as a daily bias filter, not an entry signal.
• Around high-impact events (CPI, NFP, FOMC, ECB), check whether the move in price is confirmed by yields.
• Watch for divergences between price and the spread.
Note: DE02Y intraday data is sparse outside European hours; a stepped line is expected

免責事項
これらの情報および投稿は、TradingViewが提供または承認する金融、投資、取引、またはその他の種類の助言もしくは推奨であることを意図したものではなく、またこれらに該当するものでもありません。詳細は利用規約をご覧ください。
免責事項
これらの情報および投稿は、TradingViewが提供または承認する金融、投資、取引、またはその他の種類の助言もしくは推奨であることを意図したものではなく、またこれらに該当するものでもありません。詳細は利用規約をご覧ください。