OPEN-SOURCE SCRIPT
更新済 NSE/BSE Key Support & Resistance | MTF Pro-3.1
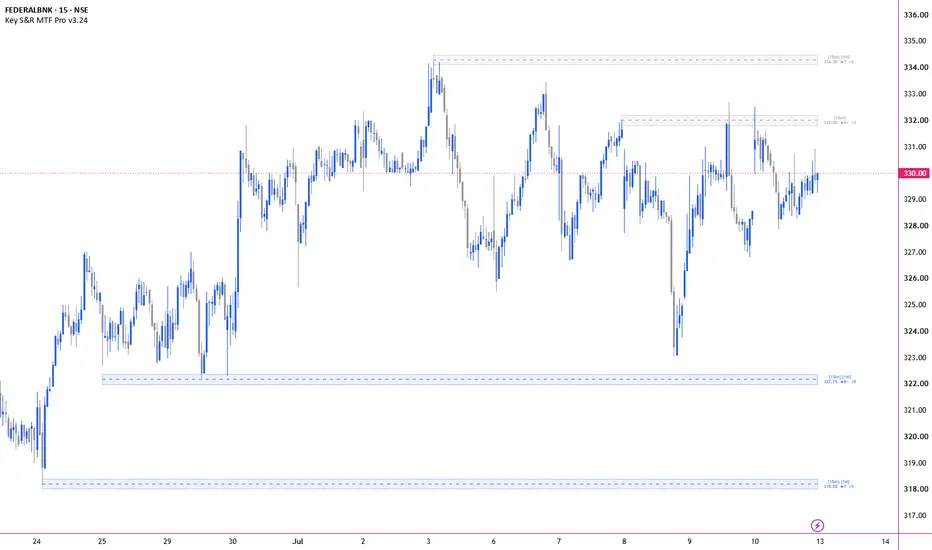
Advanced pivot-based Support & Resistance with multi-timeframe confluence, strength scoring, volume-confirmed breaks, and adaptive zone visuals — built specifically for Indian stock market (NSE/BSE).
Overview
Most S&R indicators draw every pivot as an equal horizontal line and extend it infinitely to the right — creating cluttered, unreadable charts. This indicator solves that by scoring every level based on how strongly price rejected it, merging overlapping levels from different timeframes into a single confluence zone, and only showing the levels that actually matter.
Built and tuned specifically for NSE and BSE stocks, indices (Nifty 50, Bank Nifty, Sensex), and F&O instruments.
Key Features
🔷 Multi-Timeframe Support (4 TFs)
Enable up to 4 independent timeframes simultaneously. Each timeframe's pivots are detected separately and tagged in the label — [15m], [1H], [D], [W]. You choose which timeframes to activate.
🔷 Cross-TF Confluence Merge
When two different timeframes produce a pivot at nearly the same price (within ATR proximity), they automatically merge into a single stronger zone instead of drawing two overlapping boxes. The label shows both sources — [1H] [D] — and the level receives a confluence strength bonus. These merged zones are your highest-priority trade levels.
🔷 Advanced Strength Scoring
Every level carries a live strength score (★) that accumulates over time. Each touch is scored individually based on:
Wick size relative to candle range (how strongly price rejected)
Distance of close from the level (how convincingly price pulled back)
Whether volume was above average on that candle
Whether a strong body / engulfing candle formed
A barely touching wick scores ~0.5. A high-volume hammer rejection scores ~5–6. The score drives both zone opacity and zone width — strong levels appear bold and wide, weak levels fade visually.
🔷 Volume-Based Break Filter
A level is only invalidated when price closes beyond it and volume meets a configurable threshold (default: 1× average volume). Low-volume spikes through a level are ignored as false breakouts — the zone remains valid. Break alerts include the volume ratio so you know the conviction behind the move.
🔷 Adaptive Zone Visuals
No right extension — zones terminate at the current bar (valid) or the break bar (broken). No infinite lines cluttering the right side of your chart.
Opacity scales with strength — strongest levels are most visible, weakest levels are nearly transparent.
Zone width scales with strength — high-confidence zones are wider, giving a visual sense of the price area's importance.
🔷 Clean Labels
Each label shows the full picture at a glance:
[1H] [D]
21450.00 ★6.5 ×3
Timeframe source | Price | Strength score | Touch count
Settings Guide
SettingWhat it doesPivot LengthBars each side to confirm a pivot. Higher = fewer, stronger levelsMin StrengthHide levels below this score. Raise to show only confirmed levelsATR Merge DistanceHow close two levels must be to merge into oneInvalidationClose-based (reliable) or Wick-based (faster) break detectionVolume Break FilterRequire above-average volume to confirm a breakoutMin Volume MultiplierHow many times average volume needed to confirm a breakMax Active LevelsCap total zones shown on chartStrength → Zone OpacityToggle adaptive opacity based on strength score
How to Use
Bounce trades — price enters a green (support) zone → wait for a rejection candle with volume → enter above the rejection candle high, SL below zone bottom.
Rejection trades — price enters a red (resistance) zone → wait for a bearish candle with volume → enter below candle low, SL above zone top.
Breakout trades — price closes beyond a zone with high volume (break alert fires) → wait for pullback to the broken level → trade in the direction of the break.
Highest priority setups — zones tagged [1H] [D] or [D] [W] with ★ score above 5 and multiple touches. These are the levels institutional money respects.
Alerts
The indicator fires alert() calls for:
Break confirmed — includes ticker, price, and volume ratio
Retest — includes ticker, price, and touch quality score
Set alert condition to "Any alert() function call" in TradingView's alert dialog.
Notes
Designed and tested on NSE/BSE equities and F&O stocks
Works on any timeframe from 1 minute to Weekly
All calculations are original — pivot detection, strength engine, confluence merge, and volume filter are built from scratch in Pine Script v6
Overview
Most S&R indicators draw every pivot as an equal horizontal line and extend it infinitely to the right — creating cluttered, unreadable charts. This indicator solves that by scoring every level based on how strongly price rejected it, merging overlapping levels from different timeframes into a single confluence zone, and only showing the levels that actually matter.
Built and tuned specifically for NSE and BSE stocks, indices (Nifty 50, Bank Nifty, Sensex), and F&O instruments.
Key Features
🔷 Multi-Timeframe Support (4 TFs)
Enable up to 4 independent timeframes simultaneously. Each timeframe's pivots are detected separately and tagged in the label — [15m], [1H], [D], [W]. You choose which timeframes to activate.
🔷 Cross-TF Confluence Merge
When two different timeframes produce a pivot at nearly the same price (within ATR proximity), they automatically merge into a single stronger zone instead of drawing two overlapping boxes. The label shows both sources — [1H] [D] — and the level receives a confluence strength bonus. These merged zones are your highest-priority trade levels.
🔷 Advanced Strength Scoring
Every level carries a live strength score (★) that accumulates over time. Each touch is scored individually based on:
Wick size relative to candle range (how strongly price rejected)
Distance of close from the level (how convincingly price pulled back)
Whether volume was above average on that candle
Whether a strong body / engulfing candle formed
A barely touching wick scores ~0.5. A high-volume hammer rejection scores ~5–6. The score drives both zone opacity and zone width — strong levels appear bold and wide, weak levels fade visually.
🔷 Volume-Based Break Filter
A level is only invalidated when price closes beyond it and volume meets a configurable threshold (default: 1× average volume). Low-volume spikes through a level are ignored as false breakouts — the zone remains valid. Break alerts include the volume ratio so you know the conviction behind the move.
🔷 Adaptive Zone Visuals
No right extension — zones terminate at the current bar (valid) or the break bar (broken). No infinite lines cluttering the right side of your chart.
Opacity scales with strength — strongest levels are most visible, weakest levels are nearly transparent.
Zone width scales with strength — high-confidence zones are wider, giving a visual sense of the price area's importance.
🔷 Clean Labels
Each label shows the full picture at a glance:
[1H] [D]
21450.00 ★6.5 ×3
Timeframe source | Price | Strength score | Touch count
Settings Guide
SettingWhat it doesPivot LengthBars each side to confirm a pivot. Higher = fewer, stronger levelsMin StrengthHide levels below this score. Raise to show only confirmed levelsATR Merge DistanceHow close two levels must be to merge into oneInvalidationClose-based (reliable) or Wick-based (faster) break detectionVolume Break FilterRequire above-average volume to confirm a breakoutMin Volume MultiplierHow many times average volume needed to confirm a breakMax Active LevelsCap total zones shown on chartStrength → Zone OpacityToggle adaptive opacity based on strength score
How to Use
Bounce trades — price enters a green (support) zone → wait for a rejection candle with volume → enter above the rejection candle high, SL below zone bottom.
Rejection trades — price enters a red (resistance) zone → wait for a bearish candle with volume → enter below candle low, SL above zone top.
Breakout trades — price closes beyond a zone with high volume (break alert fires) → wait for pullback to the broken level → trade in the direction of the break.
Highest priority setups — zones tagged [1H] [D] or [D] [W] with ★ score above 5 and multiple touches. These are the levels institutional money respects.
Alerts
The indicator fires alert() calls for:
Break confirmed — includes ticker, price, and volume ratio
Retest — includes ticker, price, and touch quality score
Set alert condition to "Any alert() function call" in TradingView's alert dialog.
Notes
Designed and tested on NSE/BSE equities and F&O stocks
Works on any timeframe from 1 minute to Weekly
All calculations are original — pivot detection, strength engine, confluence merge, and volume filter are built from scratch in Pine Script v6
リリースノート
Add to Key Features section (after Volume-Based Break Filter):🔷 NSE Session Filter
Two sub-toggles to block pivots formed during artificial NSE sessions:
Pre-Open (9:00–9:15 AM IST) — the call auction window before regular market opens. Operators place and cancel orders during this period, creating price spikes that snap back the moment regular trading begins at 9:15. These prints form false pivots that never get meaningfully retested.
Closing Auction (3:25–3:30 PM IST) — the closing price discovery session runs on thin liquidity. A single large order can spike price significantly away from the day's true range, creating misleading pivot highs and lows.
Filtering both sessions ensures your S&R levels are built entirely from real market-hours price action.
🔷 Historical Rendering Toggle
OFF (default) — zones draw only on the last bar. Lightweight and fast, ideal for live trading and real-time monitoring.
ON — zones draw correctly on every historical bar using bar_index positioning. When you scroll back in time, each zone terminates exactly at its break bar instead of stretching all the way to today. Essential for backtesting setups and studying how past levels behaved.
Add to Settings Guide table (new rows):
SettingWhat it doesNSE Session FilterMaster toggle to block pre-open and closing auction pivot formationBlock Pre-OpenIgnores pivots formed between 9:00–9:15 AM ISTBlock Closing AuctionIgnores pivots formed between 3:25–3:30 PM ISTHistorical RenderingON for backtesting accuracy, OFF for live trading performance
Add to Notes section:
NSE Session Filter evaluated in Asia/Kolkata (IST) timezone — works correctly regardless of your TradingView account timezone setting
Historical Rendering uses bar_index positioning for pixel-accurate zone boundaries on any chart timeframe
リリースノート
Historical Rendering removed in v3.4 — zone boundaries are accurate on last bar without the added complexity.リリースノート
Add to Key Features (after NSE Session Filter section):🔷 Strength Label Cap (★8+)
Every level displays a live strength score built from touch quality — wick size, close distance, volume, and candle body. Previously this score could show ★42.0 on heavily tested levels, which was visually meaningless. Now the display caps at ★8+ once a level crosses the threshold — anything above 8 gives no additional visual information. The underlying score continues accumulating and drives opacity and zone width correctly, only the label display is capped.
🔷 Volatility-Aware ATR Merge
The ATR merge threshold that determines when two nearby levels combine into one confluence zone now adapts automatically to market conditions. On normal days the threshold works as configured. On high-volatility days — Budget announcements, RBI policy decisions, quarterly results — the current ATR expands significantly above its 50-bar baseline. When ATR > 1.5× slow ATR, the merge threshold automatically halves. This prevents two genuinely separate levels from being incorrectly merged into one zone just because volatility expanded the proximity radius. No manual adjustment needed — it detects event-day conditions automatically.
Add to Settings Guide table:
Setting What it does Volatility-Aware Merge Auto-tightens merge threshold on high-vol days (Budget, RBI, Results)
Update Notes section — add:
v3.5 — Strength label capped at ★8+ for cleaner display. Volatility-aware merge threshold automatically tightens on event days to prevent false confluence merges.
How to Use — add under Highest Priority Setups:
Reading the strength score:
Score Meaning
★1–2 Fresh pivot, not yet confirmed
★3–4 Tested once with decent rejection
★5–6 Strong level, multiple quality rejections
★7–8+ Key institutional level, high conviction
On event days (Budget, RBI, Results) when Volatility-Aware Merge is ON, levels that appear as separate zones instead of merged are genuinely independent — price is likely to react at both individually rather than treating them as one cluster.
Disclaimer
This indicator is published for educational and informational purposes only. It is not financial advice, investment advice, or a trading recommendation of any kind.
Support and resistance levels identified by this indicator are based on historical price action and mathematical calculations. Past performance of any level or pattern does not guarantee future results.
Trading involves significant risk of loss. You should:
Never trade with money you cannot afford to lose
Always use proper risk management including stop-losses
Make your own independent trading decisions
This indicator does not claim to predict market movements. The authors and publishers of this script accept no responsibility for any trading losses incurred through its use.
Use at your own risk.
For NSE/BSE use — Indian markets involve additional risks including circuit breakers, operator activity, low liquidity in mid/small caps, and event-driven volatility. These factors are not fully accounted for by any technical indicator.
リリースノート
Add to Key Features (after Adaptive Zone Visuals section):🔷 Dashed Border Zone Style (Toggle)
An alternative zone visualization mode available under Visual Style settings. When enabled, zones switch from the default filled style to a clean dashed border design:
Support → Blue (#2962FF) with 9% fill, dotted border, and blue label text
Resistance → Grey (#9598A1) with 9% fill, dotted border, and grey label text
Center line → Dashed midline at the exact price level for precise reference
Labels → Automatically match the zone color — blue for support, grey for resistance
Toggle OFF returns completely to the existing filled green/red zone style with original label colors — no other settings are affected.
Especially recommended for traders using the standard red and green candlestick color scheme — the blue and grey zone colors avoid visual conflict with bullish (green) and bearish (red) candles, making it easier to distinguish candle direction from zone type at a quick glance.
Add to Settings Guide table:
Setting What it does
Dashed OFF = filled green/red zones with green/red labels (default). ON = dotted border, 9% fill,
Border Style blue/grey colors with dashed center line and matching label colors
リリースノート
Add to Key Features (after Dashed Border Zone Style):🔷 Three Zone Display Styles
The indicator now offers three zone visualization modes under Visual Style settings, selectable from a single dropdown. Choose the style that best suits your chart setup and trading preference:
Filled (Default)
The original solid zone — green for support, red for resistance. Zone opacity and width scale with strength. Best for traders who want immediate visual impact and zone boundaries clearly marked.
Dashed
Dotted border with 9% fill and a dashed center line. Blue for support, grey for resistance. Labels match the zone color. Recommended for traders using standard red/green candlestick colors to avoid visual conflict between candles and zones.
Line
A single clean horizontal line at the exact pivot price — no box, no fill. Green for support, red for resistance. Line width is adjustable from 1 to 4. The most minimal option — keeps the chart clean while still marking every key level precisely. Best for traders who prefer a clutter-free chart or are running multiple indicators simultaneously.
Update Settings Guide table:
Setting What it does
Zone Style Filled = solid zones (default). Dashed = dotted border, 9% fill, blue/grey. Line = single horizontal line only
Line Width Controls line thickness when Zone Style is set to Line (1–4)
Update Notes section — add:
v3.8 — Zone Style dropdown added with three options: Filled (default), Dashed (blue/grey, dotted border, dashed center line), and Line (single clean horizontal line). Line Width input controls thickness in Line mode.
リリースノート
Add to Key Features (as a new section):🔷 Dashed Border Zone Style (Toggle)
An alternative zone visualization mode available under Visual Style settings. When enabled, zones switch from the default filled style to a clean dashed border design:
Support → User-selectable color (default blue #2962FF) with 9% fill, dotted border, and matching label text
Resistance → User-selectable color (default grey #9598A1) with 9% fill, dotted border, and matching label text
Center line → Dashed midline at the exact price level for precise reference
Labels → Automatically match the zone color
Dashed zone colors are fully customizable — if your candlestick scheme uses blue and grey, simply switch the dashed colors to green and red to avoid visual conflict. Toggle OFF returns completely to the existing filled zone style.
Recommended color combinations by candle scheme:
Candle Colors Suggested Dashed Zone Colors
Green / Red (TradingView default) Blue / Grey (indicator default)
Blue / GreyGreen / Red
Custom Any contrasting color
🔷 Market Preset (One-Click Configuration)
A single dropdown at the top of settings that automatically configures the indicator for the selected market — no manual tuning required when switching between instruments.
PresetPivot LengthATR MergeVol MultiplierSession FilterNSE/BSE100.301.0×ONForex120.400.6×OFFGold (XAUUSD)120.400.6×OFFCrypto100.500.8×OFFFutures100.350.8×OFFCustomManualManualManualManual
Select Custom to set all values manually. For all other presets, the configured values silently override the manual inputs — switch markets in one click without adjusting individual settings.
Note: Forex and Gold use a lower volume multiplier (0.6×) because TradingView reports tick volume rather than real exchange volume on these instruments — requiring a lower threshold to avoid missing valid breaks.
Add to Settings Guide table:
SettingWhat it doesMarket PresetOne-click auto-configuration for NSE, Forex, Gold, Crypto, Futures, or CustomDashed Support ColorFill and border color for support zones in Dashed styleDashed Resistance ColorFill and border color for resistance zones in Dashed style
Update Notes section — add:
v3.10 — Market Preset dropdown added. One-click configuration for NSE/BSE, Forex, Gold (XAUUSD), Crypto, and Futures. Select Custom for full manual control.
v3.11 — Dashed zone colors are now user-selectable. Change to avoid conflict with your candlestick color scheme — blue/grey by default, switchable to green/red or any custom color.
リリースノート
Update Notes section — add:v3.19 Fix — Strength score label corrected. Previous versions could display ★5.5000001 or similar float artifacts due to Pine Script's internal float precision when converting decimal numbers to strings. Now uses pure integer math to extract the whole and decimal parts separately — outputs a clean ★5.5, ★3, ★8+ every time without exception.
リリースノート
Before:Pivot-based S&R zones with multi-timeframe confluence, strength scoring, volume-confirmed breaks, and market presets for NSE/BSE, Forex, Gold, Crypto, and Futures — one indicator for all markets.
After:
Pivot-based S&R zones with multi-timeframe confluence, strength scoring, volume-confirmed breaks, and automatic market detection for NSE/BSE, Gold, Silver, Copper, Crude Oil, Natural Gas, Forex, and Crypto — zero configuration needed.
Add to Key Features (replace Market Preset section):
🔷 Automatic Market Detection — Zero Configuration
The indicator automatically identifies the instrument loaded on your chart and configures all settings instantly. No dropdown to select, no manual tuning needed — just add the indicator and it works.
Supported instruments detected automatically:
InstrumentTickersNSE/BSE Stocks & IndicesAny NSE: or BSE: prefixGold FuturesGC1!, MGC1!Gold SpotXAUUSD, any XAU baseSilver FuturesSI1!, MSI1!, SIL1!Silver SpotXAGUSD, any XAG baseCopper FuturesHG1!, MHG1!Copper SpotXCUUSD, COPPERCrude Oil FuturesCL1!, MCL1!, QM1!Crude Oil SpotUSOIL, WTICOUSD, BCOUSDNatural Gas FuturesNG1!, MNG1!Natural Gas SpotNATGAS, UKOILCryptoAny crypto exchangeForexAny forex pairOther FuturesAny unrecognized futures
Each market uses optimized settings for pivot length, ATR merge distance, volume threshold, and zone width. Futures instruments use real exchange volume (higher threshold) while spot instruments use tick volume (lower threshold) automatically.
Why futures and spot are treated differently:
Exchange-traded futures (GC1!, CL1!, NG1! etc.) report real transactional volume from the exchange. Spot instruments on TradingView (XAUUSD, USOIL etc.) report tick volume — an estimate, not actual traded volume. The volume break filter threshold is set higher for futures (1.0×) and lower for spot (0.6×) to account for this difference.
Add to Settings Guide — remove Market Preset row, add:
SettingWhat it doesAuto Market DetectionRuns silently on every chart load — no user action needed. Falls back to Custom if instrument is unrecognized.
Notes
v3.23 — Market Preset dropdown removed. Instrument type now detected automatically using syminfo — NSE/BSE, Gold, Forex, Crypto, Futures all configure themselves on chart load. No manual selection needed.
v3.24 — Added Silver, Copper, Crude Oil, and Natural Gas to auto-detection. Both spot and futures variants detected separately with optimized settings per instrument. Natural Gas gets widest zones (0.25×ATR) due to highest volatility among supported commodities.
リリースノート
Key S&R MTF Pro — Complete SummaryWhat It Is
A professional-grade Support & Resistance indicator built from scratch in Pine Script v6. Designed for traders who need clean, meaningful price levels — not cluttered charts full of weak pivots and extending lines.
Core Engine
Pivot-based S&R detection with a 4-component strength scoring system. Every level earns a score based on wick quality, close distance from the level, volume above average, and candle body strength. Levels are ranked by score — only the strongest N zones are shown. Weaker levels are calculated but never drawn.
Key Features
Multi-Timeframe Confluence
Up to 4 timeframes simultaneously. When two TFs produce a pivot at the same price, they merge into one stronger zone with a combined label like [15m] [1H] and a +1.5 strength bonus.
Automatic Market Detection
No settings needed. Load the indicator on any chart and it auto-detects the instrument — NSE/BSE stocks, Gold Futures (GC1!/MGC1!), Silver Futures (SI1!), Copper Futures (HG1!), Crude Oil Futures (CL1!), Natural Gas Futures (NG1!), their spot equivalents, Forex, Crypto, and general Futures — each with optimized pivot length, ATR merge, volume threshold, and zone width.
Volume Break Filter
A level is only invalidated when price closes beyond it AND volume confirms the move. Low-volume false breakouts are ignored. Futures use real exchange volume (1.0× threshold), spot instruments use tick volume (0.6× threshold) — detected and applied automatically.
Volatility-Aware ATR Merge
On high-volatility days (Budget, RBI, Results, FOMC) when current ATR exceeds 1.5× its 50-bar baseline, the merge threshold tightens automatically. Prevents two genuinely separate levels from being incorrectly merged into one zone during event-day volatility spikes.
NSE Session Filter
Blocks pivots formed during pre-open (9:00–9:15 AM IST) and closing auction (3:25–3:30 PM IST). These sessions create artificial price prints that generate false S&R levels. Auto-enabled only for NSE/BSE instruments.
Three Zone Styles
Dashed zone colors are user-selectable to avoid conflict with any candle color scheme.
Adaptive Visuals
Zone opacity and zone width both scale with strength score. Strongest levels appear bold and wide. Weakest levels fade visually. Chart self-organizes by importance without reading any numbers.
Strength Label
Each label shows:
[15m] [1H]
4146.40 ★5.5 ×3
TF source | Price | Strength score (capped at ★8+) | Touch count
Default Settings (Key Zones Only)
Setting Value Reason
Pivot Length 15 Fewer but more significant pivots
Min Strength 2 Only confirmed retested levels
ATR Merge 0.4 Merge nearby levels into one
Max Active Levels 4 Only 4 strongest zones on chart
Zone Style Dashed Clean, non-conflicting visuals
Alerts
BREAK ↑ MGC1! R 4146.40 | Vol: 2.3×Avg — breakout confirmed with volume
RETEST MGC1! S 4032.30 | Score +4.5 — support retested with quality rejection
Set condition to Any alert() function call in TradingView.
Markets Supported
NSE/BSE · Gold GC1!/MGC1!/XAUUSD · Silver SI1!/XAGUSD · Copper HG1!/XCUUSD · Crude Oil CL1!/USOIL · Natural Gas NG1!/NATGAS · Forex · Crypto · Futures
What Makes It Unique
Three features exist nowhere else on TradingView:
NSE Session Filter — pre-open and closing auction blocking in IST timezone
Volatility-Aware Merge — auto-tightens on event days
Full commodity auto-detection — spot and futures variants with separate volume handling
Technical
Pine Script v6 — zero warnings, zero errors
max_bars_back(300) performance optimization
No right extension — zones terminate at break bar
Clean code — under 500 lines
Author: Fx-Jithin
Not financial advice. Trade at your own risk.
オープンソーススクリプト
TradingViewの精神に則り、このスクリプトの作者はコードをオープンソースとして公開してくれました。トレーダーが内容を確認・検証できるようにという配慮です。作者に拍手を送りましょう!無料で利用できますが、コードの再公開はハウスルールに従う必要があります。

免責事項
これらの情報および投稿は、TradingViewが提供または承認する金融、投資、取引、またはその他の種類の助言もしくは推奨であることを意図したものではなく、またこれらに該当するものでもありません。詳細は利用規約をご覧ください。
オープンソーススクリプト
TradingViewの精神に則り、このスクリプトの作者はコードをオープンソースとして公開してくれました。トレーダーが内容を確認・検証できるようにという配慮です。作者に拍手を送りましょう!無料で利用できますが、コードの再公開はハウスルールに従う必要があります。
免責事項
これらの情報および投稿は、TradingViewが提供または承認する金融、投資、取引、またはその他の種類の助言もしくは推奨であることを意図したものではなく、またこれらに該当するものでもありません。詳細は利用規約をご覧ください。