MA Ribbon Tension
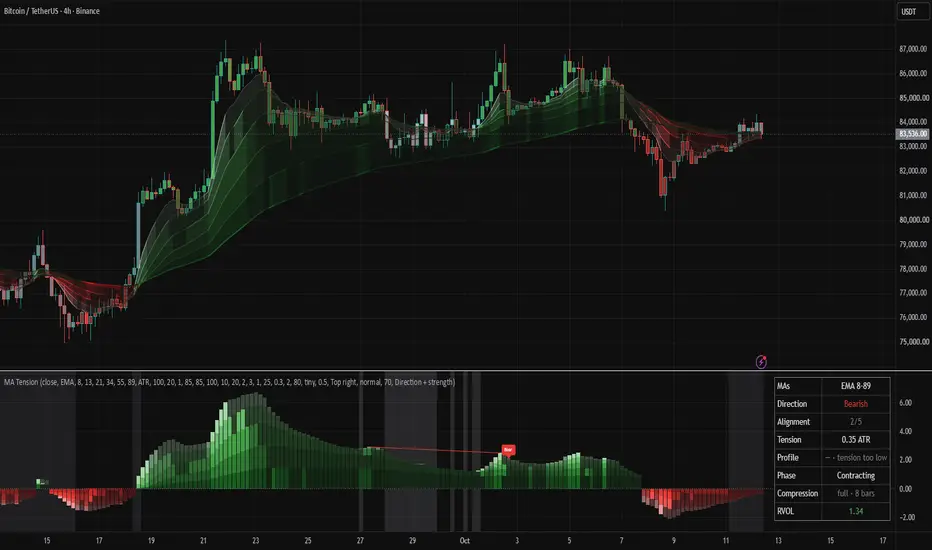
█ OVERVIEW
MA Ribbon Tension is a tool for analyzing the state of a trend, based on a ribbon of six moving averages (MA ribbon). It does not tell you when to buy or sell. Instead, it helps you understand the character of the move: whether a trend exists at all, how strong it is, whether it is only just gaining momentum, whether it is already maturing and losing impetus, or whether the market is transitioning into a consolidation phase.
The core of the indicator is a multi-layer ribbon tension histogram. Each layer represents the gap between adjacent moving averages. Only gaps aligned with the direction of the trend are included in the tension. The trend direction is defined by the position of the fastest moving average (MA 1) relative to the slowest (MA 6). The height of the histogram therefore reflects the width of the ordered ribbon, while its structure shows which part of the ribbon is driving the move.
The picture is completed by: an assessment of the ordering of the moving averages (alignment), a pace profile (young or mature trend), the dynamics phase of the layers, and two-level compression detection. Optionally, divergences between price and tension as well as volume confirmation can be added. A status table continuously gathers all readings in one place. The indicator can also draw the ribbon on the price chart, color candles according to the state of the ribbon, and mark compression with the panel background.
█ CONCEPTS
The indicator combines ribbon analysis of moving averages, gap normalization, pace profile, compression, and optional divergences. The mere arrangement of the moving averages does not create a signal – what matters is their relative layout, width, and the dynamics of changes.
Ribbon structure
The ribbon consists of six moving averages of increasing lengths (by default the Fibonacci sequence 8–13–21–34–55–89). All moving averages are of the same type (EMA, SMA, WMA, RMA, or VWMA).
The direction of the ribbon is determined by the position of MA 1 relative to MA 6:
• MA 1 above MA 6 → bullish direction (histogram above zero),
• MA 1 below MA 6 → bearish direction (histogram below zero).
Alignment is the number of adjacent moving-average pairs (out of five) ordered in the direction of the ribbon. A value of 5/5 means a clean, fully formed ribbon. Lower values indicate a forming trend, a pullback, or tangled moving averages.
Ribbon tension
The gaps between adjacent moving averages are normalized (ATR, % of price, or price units) and accumulated only when the pair is ordered in the direction of the trend. A reversed pair has zero thickness – a tangled ribbon does not inflate the tension.
Layers are drawn from the slowest (next to the zero line) to the fastest (on the outside). Total tension corresponds to the height of the histogram. Rising tension means the ribbon is widening; falling tension means it is contracting.
Ribbon profile
The profile compares the pace read from the fast moving averages (MA 1–3) with the pace read from the slow ones (MA 4–6). Values are scaled so that in a steady trend the profile is approximately 1.0× regardless of the type and length of the moving averages.
• > 1.0× – the fast layers are widening faster than the underlying trend (young or accelerating trend),
• < 1.0× – the trend is carried mainly by the slow averages (mature or slowing),
• within the neutral zone – the profile is stable.
The profile is not rated when tension is too low relative to its average – on a nearly flat ribbon the ratio of the layers carries no information.
Compression
The indicator detects two levels of compression. The width of the ribbon (the sum of the distances between adjacent moving averages, regardless of their order) is compared with percentiles from a selected historical window. Additionally, the moving averages must be tangled – a tight but orderly ribbon indicates a calm trend, not consolidation.
• Local compression – the fast moving averages (MA 1–4) are close together and tangled. This usually indicates consolidation or a flag within an ongoing trend. It appears earlier than full compression.
• Full compression – the entire ribbon (including the slowest moving averages) is tight and tangled. This indicates a mature base after an extended trendless period.
Compression has hysteresis – separate entry and exit thresholds limit signal flickering. It ends when the width exceeds the exit percentile or when the moving averages become fully aligned with the direction. A minimum number of bars can also be set, below which compression is not taken into account. The panel background changes color during active compression (full takes precedence over local).
Trend phase
The indicator classifies the current dynamics of the layers:
• Full expansion – all gaps are widening (impulse phase),
• Momentum fading – fast layers are narrowing while slow layers continue to widen (typical of a fading impulse),
• Widening – total tension is rising,
• Contracting – total tension is falling.
Divergences
An optional module detects regular and hidden divergences between price extremes and the peaks of the tension histogram. Only peaks from the same trend leg are compared, and they must not be more than the set number of bars apart.
• Regular divergence (Bear / Bull) – a sign of a weakening trend. Price makes a higher high while the tension of a bullish ribbon makes a lower one (or a lower low while the tension of a bearish ribbon is smaller).
• Hidden divergence (hBull / hBear) – a continuation signal. Price makes a lower high in an uptrend while tension makes a higher one (or a higher low in a downtrend while tension rises).
Regular divergences are enabled by default; hidden ones are disabled. Labels appear on the confirming bar. Peaks lower than a set multiple of the average tension are ignored.
Volume
A widening ribbon shows that price is moving, but not whether the market is behind the move – an expansion backed by rising participation is more likely to continue than one that happens on thin volume. Optional volume confirmation therefore dims histogram layers that are widening while relative volume is below the threshold. RVOL is calculated as current volume divided by the average and smoothed with an EMA. On instruments without volume data the filter has no effect.
Status table
The diagnostic table continuously shows:
• type and length range of the moving averages,
• ribbon direction,
• alignment (0–5),
• total tension with the normalization unit,
• profile (value and rating: young/accelerating, mature/slowing, stable),
• dynamics phase,
• compression state and its length,
• relative volume (RVOL).
Each row has a tooltip with an explanation.
Candle coloring and ribbon on the price chart
Candles can be colored according to direction, strength (alignment + change in tension), or trend phase. During compression they can take the compression background color. Optionally, candles are additionally dimmed on weak volume.
The moving-average ribbon can be drawn on the price chart with fill between the layers. Layer colors match the histogram (full color when widening with volume, dimmed when there is no volume or when narrowing).
█ FEATURES
• Ribbon of six moving averages (EMA, SMA, WMA, RMA, VWMA) with configurable lengths.
• Tension histogram composed of five layers (gaps between adjacent moving averages).
• Gap normalization: ATR, percent of price, or price units.
• Trend direction based on MA 1 vs MA 6.
• Alignment – number of pairs ordered in the direction (0–5).
• Ribbon profile (ratio of the pace of fast to slow layers) with ratings young/accelerating, mature/slowing, stable.
• Two levels of compression: local (MA 1–4) and full (entire ribbon) with percentiles, a tangled-averages condition, hysteresis, and a minimum length.
• Dynamics phase: Full expansion, Momentum fading, Widening, Contracting.
• Optional regular divergences (Bear/Bull) and hidden divergences (hBull/hBear) between tension and price.
• Filtering of divergence peaks by height relative to average tension.
• Volume confirmation (RVOL) that dims layers without volume participation.
• Status table with direction, alignment, tension, profile, phase, compression, and RVOL.
• Optional moving-average ribbon on the price chart with layer fills.
• Candle coloring by direction, strength, or trend phase, with an option for compression color and dimming on weak volume.
• Configurable layer colors (separately for bullish and bearish order).
• Panel background during compression (local or full).
• Alerts: full expansion (with and without volume), start/end of local and full compression, profile change (at alignment ≥ 4/5), momentum fading, regular divergences, divergences confirmed by declining volume, and hidden divergences.
█ APPLICATIONS
Analysis of trend strength and maturity
Tension and the profile make it possible to distinguish a young, accelerating trend from a mature one that is losing impetus. Alignment shows whether the ribbon is clean or the moving averages have become tangled. The “Momentum fading” phase often appears before a more pronounced slowdown.
Identification of consolidation
Local and full compression highlight periods in which the moving averages are converging. Local compression with wide slow layers usually indicates a flag or consolidation within a trend. Full compression indicates a mature base.
Assessment of move quality
Dimming of layers at low RVOL helps separate moves supported by volume from those without market participation. The table allows you to quickly check whether the current state of the ribbon meets your own quality criteria.
Divergences as a warning
A regular tension divergence relative to price can signal a weakening of the trend before the moving averages reverse. Hidden divergences can confirm continuation after a pullback. The indicator compares only peaks from the same trend leg, which limits false signals.
Example of use
MA Ribbon Tension is best treated as a tool that describes the trend environment rather than as an entry-signal generator. Before making a decision it is worth taking into account:
• alignment and total tension,
• the profile (whether the trend is young or maturing),
• the dynamics phase of the layers,
• the presence and type of compression,
• relative volume,
• any divergences,
• the broader price context and higher timeframes.
The status table allows you to continuously assess the state of the ribbon without having to interpret the histogram itself.
█ NOTES
• Moving-average lengths must increase from MA 1 to MA 6 – otherwise the indicator reports an error.
• Divergences are confirmed with a delay equal to the pivot length (the label appears on the confirming bar).
• When the minimum compression length is greater than 1, the background appears on the confirming bar (N−1 bars after the actual start of the compression). The indicator does not repaint history.
• The profile is not rated when tension is too low.
• Candle coloring overrides the colors set on the chart – when disabled, the default colors return.
• Dimming of layers and candles on weak volume does not work on instruments without volume data; VWMA then behaves like an SMA.
MA Ribbon Tension is a tool for analyzing the state of a trend, based on a ribbon of six moving averages (MA ribbon). It does not tell you when to buy or sell. Instead, it helps you understand the character of the move: whether a trend exists at all, how strong it is, whether it is only just gaining momentum, whether it is already maturing and losing impetus, or whether the market is transitioning into a consolidation phase.
The core of the indicator is a multi-layer ribbon tension histogram. Each layer represents the gap between adjacent moving averages. Only gaps aligned with the direction of the trend are included in the tension. The trend direction is defined by the position of the fastest moving average (MA 1) relative to the slowest (MA 6). The height of the histogram therefore reflects the width of the ordered ribbon, while its structure shows which part of the ribbon is driving the move.
The picture is completed by: an assessment of the ordering of the moving averages (alignment), a pace profile (young or mature trend), the dynamics phase of the layers, and two-level compression detection. Optionally, divergences between price and tension as well as volume confirmation can be added. A status table continuously gathers all readings in one place. The indicator can also draw the ribbon on the price chart, color candles according to the state of the ribbon, and mark compression with the panel background.
█ CONCEPTS
The indicator combines ribbon analysis of moving averages, gap normalization, pace profile, compression, and optional divergences. The mere arrangement of the moving averages does not create a signal – what matters is their relative layout, width, and the dynamics of changes.
Ribbon structure
The ribbon consists of six moving averages of increasing lengths (by default the Fibonacci sequence 8–13–21–34–55–89). All moving averages are of the same type (EMA, SMA, WMA, RMA, or VWMA).
The direction of the ribbon is determined by the position of MA 1 relative to MA 6:
• MA 1 above MA 6 → bullish direction (histogram above zero),
• MA 1 below MA 6 → bearish direction (histogram below zero).
Alignment is the number of adjacent moving-average pairs (out of five) ordered in the direction of the ribbon. A value of 5/5 means a clean, fully formed ribbon. Lower values indicate a forming trend, a pullback, or tangled moving averages.
Ribbon tension
The gaps between adjacent moving averages are normalized (ATR, % of price, or price units) and accumulated only when the pair is ordered in the direction of the trend. A reversed pair has zero thickness – a tangled ribbon does not inflate the tension.
Layers are drawn from the slowest (next to the zero line) to the fastest (on the outside). Total tension corresponds to the height of the histogram. Rising tension means the ribbon is widening; falling tension means it is contracting.
Ribbon profile
The profile compares the pace read from the fast moving averages (MA 1–3) with the pace read from the slow ones (MA 4–6). Values are scaled so that in a steady trend the profile is approximately 1.0× regardless of the type and length of the moving averages.
• > 1.0× – the fast layers are widening faster than the underlying trend (young or accelerating trend),
• < 1.0× – the trend is carried mainly by the slow averages (mature or slowing),
• within the neutral zone – the profile is stable.
The profile is not rated when tension is too low relative to its average – on a nearly flat ribbon the ratio of the layers carries no information.
Compression
The indicator detects two levels of compression. The width of the ribbon (the sum of the distances between adjacent moving averages, regardless of their order) is compared with percentiles from a selected historical window. Additionally, the moving averages must be tangled – a tight but orderly ribbon indicates a calm trend, not consolidation.
• Local compression – the fast moving averages (MA 1–4) are close together and tangled. This usually indicates consolidation or a flag within an ongoing trend. It appears earlier than full compression.
• Full compression – the entire ribbon (including the slowest moving averages) is tight and tangled. This indicates a mature base after an extended trendless period.
Compression has hysteresis – separate entry and exit thresholds limit signal flickering. It ends when the width exceeds the exit percentile or when the moving averages become fully aligned with the direction. A minimum number of bars can also be set, below which compression is not taken into account. The panel background changes color during active compression (full takes precedence over local).
Trend phase
The indicator classifies the current dynamics of the layers:
• Full expansion – all gaps are widening (impulse phase),
• Momentum fading – fast layers are narrowing while slow layers continue to widen (typical of a fading impulse),
• Widening – total tension is rising,
• Contracting – total tension is falling.
Divergences
An optional module detects regular and hidden divergences between price extremes and the peaks of the tension histogram. Only peaks from the same trend leg are compared, and they must not be more than the set number of bars apart.
• Regular divergence (Bear / Bull) – a sign of a weakening trend. Price makes a higher high while the tension of a bullish ribbon makes a lower one (or a lower low while the tension of a bearish ribbon is smaller).
• Hidden divergence (hBull / hBear) – a continuation signal. Price makes a lower high in an uptrend while tension makes a higher one (or a higher low in a downtrend while tension rises).
Regular divergences are enabled by default; hidden ones are disabled. Labels appear on the confirming bar. Peaks lower than a set multiple of the average tension are ignored.
Volume
A widening ribbon shows that price is moving, but not whether the market is behind the move – an expansion backed by rising participation is more likely to continue than one that happens on thin volume. Optional volume confirmation therefore dims histogram layers that are widening while relative volume is below the threshold. RVOL is calculated as current volume divided by the average and smoothed with an EMA. On instruments without volume data the filter has no effect.
Status table
The diagnostic table continuously shows:
• type and length range of the moving averages,
• ribbon direction,
• alignment (0–5),
• total tension with the normalization unit,
• profile (value and rating: young/accelerating, mature/slowing, stable),
• dynamics phase,
• compression state and its length,
• relative volume (RVOL).
Each row has a tooltip with an explanation.
Candle coloring and ribbon on the price chart
Candles can be colored according to direction, strength (alignment + change in tension), or trend phase. During compression they can take the compression background color. Optionally, candles are additionally dimmed on weak volume.
The moving-average ribbon can be drawn on the price chart with fill between the layers. Layer colors match the histogram (full color when widening with volume, dimmed when there is no volume or when narrowing).
█ FEATURES
• Ribbon of six moving averages (EMA, SMA, WMA, RMA, VWMA) with configurable lengths.
• Tension histogram composed of five layers (gaps between adjacent moving averages).
• Gap normalization: ATR, percent of price, or price units.
• Trend direction based on MA 1 vs MA 6.
• Alignment – number of pairs ordered in the direction (0–5).
• Ribbon profile (ratio of the pace of fast to slow layers) with ratings young/accelerating, mature/slowing, stable.
• Two levels of compression: local (MA 1–4) and full (entire ribbon) with percentiles, a tangled-averages condition, hysteresis, and a minimum length.
• Dynamics phase: Full expansion, Momentum fading, Widening, Contracting.
• Optional regular divergences (Bear/Bull) and hidden divergences (hBull/hBear) between tension and price.
• Filtering of divergence peaks by height relative to average tension.
• Volume confirmation (RVOL) that dims layers without volume participation.
• Status table with direction, alignment, tension, profile, phase, compression, and RVOL.
• Optional moving-average ribbon on the price chart with layer fills.
• Candle coloring by direction, strength, or trend phase, with an option for compression color and dimming on weak volume.
• Configurable layer colors (separately for bullish and bearish order).
• Panel background during compression (local or full).
• Alerts: full expansion (with and without volume), start/end of local and full compression, profile change (at alignment ≥ 4/5), momentum fading, regular divergences, divergences confirmed by declining volume, and hidden divergences.
█ APPLICATIONS
Analysis of trend strength and maturity
Tension and the profile make it possible to distinguish a young, accelerating trend from a mature one that is losing impetus. Alignment shows whether the ribbon is clean or the moving averages have become tangled. The “Momentum fading” phase often appears before a more pronounced slowdown.
Identification of consolidation
Local and full compression highlight periods in which the moving averages are converging. Local compression with wide slow layers usually indicates a flag or consolidation within a trend. Full compression indicates a mature base.
Assessment of move quality
Dimming of layers at low RVOL helps separate moves supported by volume from those without market participation. The table allows you to quickly check whether the current state of the ribbon meets your own quality criteria.
Divergences as a warning
A regular tension divergence relative to price can signal a weakening of the trend before the moving averages reverse. Hidden divergences can confirm continuation after a pullback. The indicator compares only peaks from the same trend leg, which limits false signals.
Example of use
MA Ribbon Tension is best treated as a tool that describes the trend environment rather than as an entry-signal generator. Before making a decision it is worth taking into account:
• alignment and total tension,
• the profile (whether the trend is young or maturing),
• the dynamics phase of the layers,
• the presence and type of compression,
• relative volume,
• any divergences,
• the broader price context and higher timeframes.
The status table allows you to continuously assess the state of the ribbon without having to interpret the histogram itself.
█ NOTES
• Moving-average lengths must increase from MA 1 to MA 6 – otherwise the indicator reports an error.
• Divergences are confirmed with a delay equal to the pivot length (the label appears on the confirming bar).
• When the minimum compression length is greater than 1, the background appears on the confirming bar (N−1 bars after the actual start of the compression). The indicator does not repaint history.
• The profile is not rated when tension is too low.
• Candle coloring overrides the colors set on the chart – when disabled, the default colors return.
• Dimming of layers and candles on weak volume does not work on instruments without volume data; VWMA then behaves like an SMA.

免責事項
これらの情報および投稿は、TradingViewが提供または承認する金融、投資、取引、またはその他の種類の助言もしくは推奨であることを意図したものではなく、またこれらに該当するものでもありません。詳細は利用規約をご覧ください。
免責事項
これらの情報および投稿は、TradingViewが提供または承認する金融、投資、取引、またはその他の種類の助言もしくは推奨であることを意図したものではなく、またこれらに該当するものでもありません。詳細は利用規約をご覧ください。