アップデート済
Heikin Ashi Oscillator
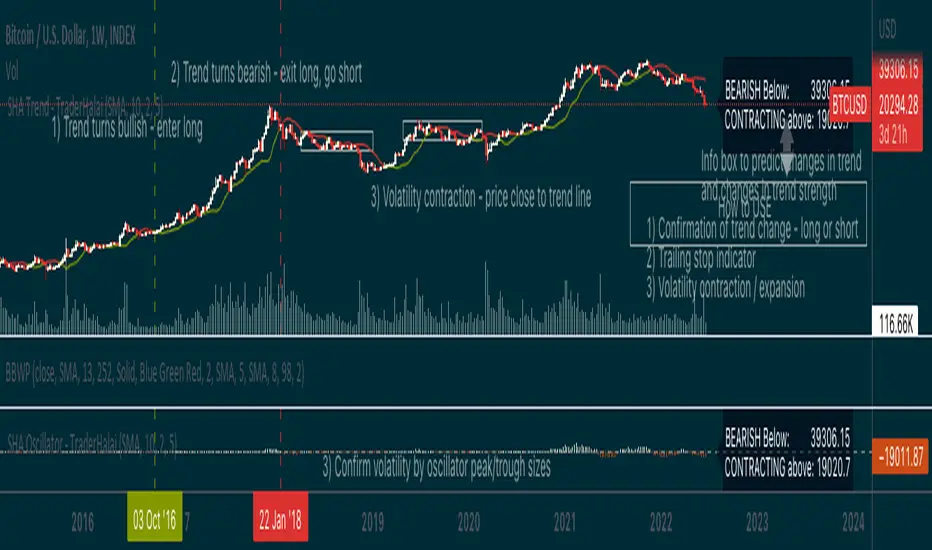
This indicator plots a delta between the Heiken Ashi close price and the regular candlestick closing price as a histogram, which allows you to quickly analyse changes in trend
direction.
It also provides a reverse-engineered closing price for regular candlesticks, to reach in order to maintain the momentum, which allows you to be forewarned of potential pivot points to change in bias in direction.
Feel free to use this indicator to modify and add to your charts as you wish.
direction.
It also provides a reverse-engineered closing price for regular candlesticks, to reach in order to maintain the momentum, which allows you to be forewarned of potential pivot points to change in bias in direction.
Feel free to use this indicator to modify and add to your charts as you wish.
リリースノート
Functions to avoid repaint if backtesting. Update to use columns instead of Histogram. Minor cleanupリリースノート
New Feature: Update script to allow for smoothing function similar to the On-Chart script that has been created also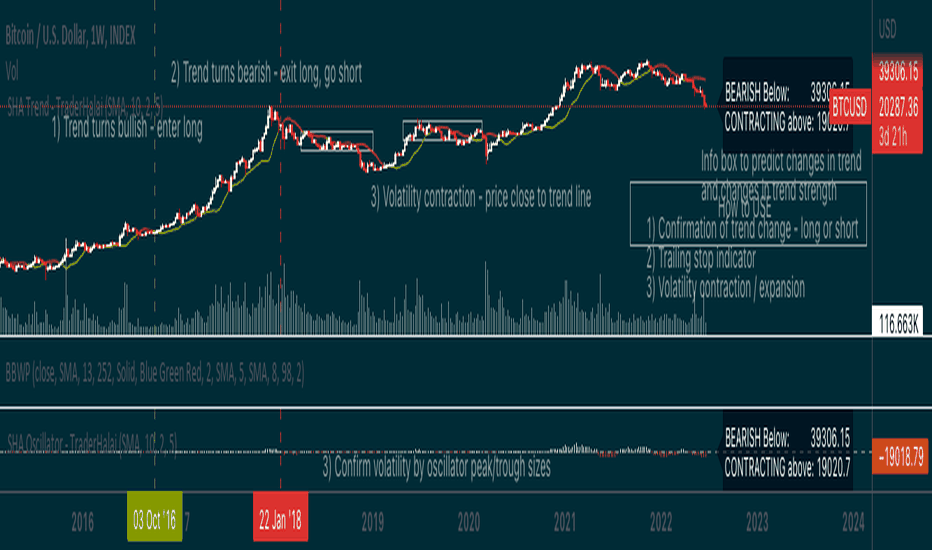
リリースノート
Added some spicy smoothing methods - Hull Moving Average, Volume Weighted Moving Average and RSI Moving Averageリリースノート
Update info box text to include volatility to assess trend strengthリリースノート
Add grow/fall colours similar to MACD to aid with visual assistance
免責事項
これらの情報および投稿は、TradingViewが提供または承認する金融、投資、取引、またはその他の種類の助言もしくは推奨であることを意図したものではなく、またこれらに該当するものでもありません。詳細は利用規約をご覧ください。
免責事項
これらの情報および投稿は、TradingViewが提供または承認する金融、投資、取引、またはその他の種類の助言もしくは推奨であることを意図したものではなく、またこれらに該当するものでもありません。詳細は利用規約をご覧ください。