HTF Fractals
HTF Fractals
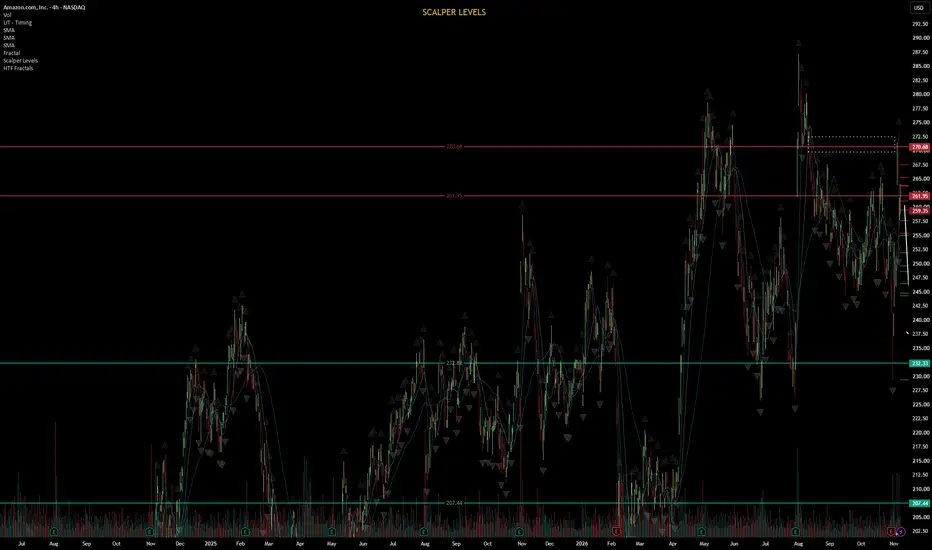
Displays Higher Timeframe (HTF) Williams Fractals directly on your lower timeframe chart as clean horizontal lines.
Features:
Plots confirmed fractal highs and lows from any higher timeframe (Daily, 4H, 1H, etc.)
Adjustable fractal strength — control how many bars are required on each side (classic Williams = 2)
Limits the number of levels shown to keep the chart clean
Fully customizable colors, line width, and whether lines extend to the right
Non-repainting on historical data
How to use:
Set your desired Higher Timeframe in the settings
Adjust “Bars each side” to control fractal sensitivity
The most recent HTF fractal highs (red) and lows (green) will appear as horizontal levels on your chart
Useful for identifying higher timeframe support/resistance and key swing points while trading on lower timeframes.
Displays Higher Timeframe (HTF) Williams Fractals directly on your lower timeframe chart as clean horizontal lines.
Features:
Plots confirmed fractal highs and lows from any higher timeframe (Daily, 4H, 1H, etc.)
Adjustable fractal strength — control how many bars are required on each side (classic Williams = 2)
Limits the number of levels shown to keep the chart clean
Fully customizable colors, line width, and whether lines extend to the right
Non-repainting on historical data
How to use:
Set your desired Higher Timeframe in the settings
Adjust “Bars each side” to control fractal sensitivity
The most recent HTF fractal highs (red) and lows (green) will appear as horizontal levels on your chart
Useful for identifying higher timeframe support/resistance and key swing points while trading on lower timeframes.

免責事項
これらの情報および投稿は、TradingViewが提供または承認する金融、投資、取引、またはその他の種類の助言もしくは推奨であることを意図したものではなく、またこれらに該当するものでもありません。詳細は利用規約をご覧ください。
免責事項
これらの情報および投稿は、TradingViewが提供または承認する金融、投資、取引、またはその他の種類の助言もしくは推奨であることを意図したものではなく、またこれらに該当するものでもありません。詳細は利用規約をご覧ください。