Dynamic Money Flow Index [SMRT Algo]
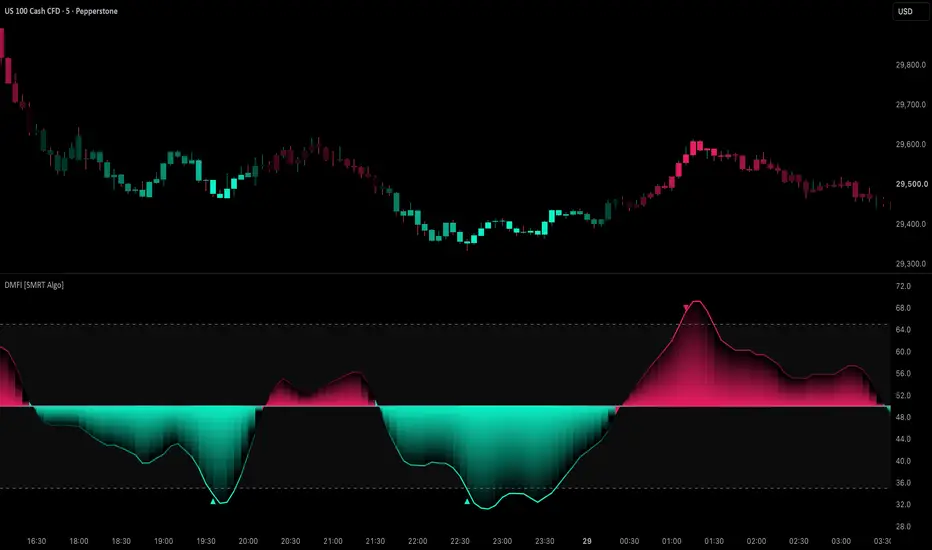
Dynamic Money Flow Index (DMFI) brings smoothed money flow, extreme-zone markers, and coordinated chart colours into one oscillator. It combines price and volume to show how positive and negative flow compare over a chosen lookback, then highlights readings approaching the upper and lower extremes.
The separate pane keeps the oscillator visible alongside price. A colour-changing 50 centerline and gradient fill make shifts around the midpoint easy to follow, while matching candle colours connect the oscillator's state to the main chart.

What makes up DMFI?
How the calculation works
Each bar's raw money flow is calculated as closing price multiplied by volume. The change in typical price, HLC3, determines which side receives that flow:
DMFI takes simple moving averages of the positive and negative series over MFI Length, divides the positive average by the negative average, and converts that ratio using 100 × ratio / (1 + ratio). A second SMA, controlled by MFI Smoothing, produces the displayed line.
This implementation uses close × volume for flow magnitude and HLC3 changes for direction. It should not be assumed to match another MFI implementation exactly. It classifies price-and-volume data; it does not measure actual buyer-initiated versus seller-initiated transactions.
Reading the colours
At the default settings, readings at or below 35 use teal and readings at or above 65 use pink. Between those thresholds and 50, the oscillator colour fades toward the chart background. The main-chart candles use this same colour function, so their colour reflects DMFI rather than whether each candle closed above or below its open.
The fill is pink above 50 and teal below 50. These are the indicator's extreme-oriented colours: pink does not automatically mean price is falling, and teal does not automatically mean price is rising. The centerline remains fixed at 50; “dynamic” describes its changing colour, not a moving level or an adaptive lookback.
Understanding the reversal markers
The alert and marker names use “Bullish Reversal” and “Bearish Reversal,” but the conditions identify entry into an extreme zone. They do not wait for the oscillator to leave that zone or for price to confirm a reversal.
Bullish Reversal — teal upward triangle
DMFI is strictly below the selected oversold threshold, and each of the previous two bars was at or above that threshold. With defaults, this means a reading below 35 after two readings of 35 or higher.
Bearish Reversal — pink downward triangle
DMFI is strictly above the selected overbought threshold, and each of the previous two bars was at or below that threshold. With defaults, this means a reading above 65 after two readings of 65 or lower.

The triangles appear at the bottom or top of the indicator pane. A reading exactly on a threshold does not trigger a new marker. Remaining inside an extreme zone does not generate another marker on every bar; the two preceding bars must satisfy the reset condition before another entry can qualify.
Settings
Current-version details
The horizontal reference lines and their background remain fixed at 35 and 65 when the threshold inputs change. Custom thresholds still affect signals, alerts, and colours. The Trend Smoothing input calculates an internal series that is not displayed or used by the signals. Show Dynamic Trend Fill is present in the inputs but is not connected to the fill in this version, so switching it off does not hide that shading.
Alerts and live-bar behaviour
Create a TradingView alert and select DMFI Bullish Reversal or DMFI Bearish Reversal. The supplied messages include the symbol, timeframe, and price placeholders. For notifications based on completed candles, select Once Per Bar Close.
The current reading, colour, and marker can change as live price and volume update. A condition visible during a bar can disappear before its close. Extreme readings can persist during a strong move, so markers are conditions to review alongside price structure rather than standalone entry instructions.
Data and scope
DMFI depends on the volume supplied by the chart's data feed. Missing volume or a zero average negative-flow value can produce unavailable readings because this version does not explicitly handle the division edge cases. Allow enough history for the lookback and smoothing to initialize.
This indicator provides chart analysis and alert conditions. It does not execute trades, calculate strategy performance, or supply stop-loss and take-profit orders. The examples illustrate its behaviour and are not performance results.
Free and open source
Published by SMRT Algo with source code available under the Mozilla Public License 2.0, so users can inspect the calculation, understand the conditions, and study how the visuals are built.
The separate pane keeps the oscillator visible alongside price. A colour-changing 50 centerline and gradient fill make shifts around the midpoint easy to follow, while matching candle colours connect the oscillator's state to the main chart.
What makes up DMFI?
- Smoothed money-flow oscillator: A configurable lookback and SMA smoothing control how quickly the plotted line responds.
- Extreme-zone colouring: Teal highlights the lower end of the oscillator; pink highlights the upper end, with colours fading toward the chart background near 50.
- Dynamic centerline and fill: The midpoint stays at 50 while its colour changes with DMFI. Shading shows the distance between the oscillator and that midpoint.
- Threshold-entry markers: Triangles identify entry into an extreme zone after two bars on the other side of the threshold.
- Two alert conditions: Separate bullish and bearish conditions are available in TradingView's alert dialog.
How the calculation works
Each bar's raw money flow is calculated as closing price multiplied by volume. The change in typical price, HLC3, determines which side receives that flow:
- When HLC3 rises, the bar contributes to positive flow.
- When HLC3 falls, the bar contributes to negative flow.
- When HLC3 is unchanged, the bar contributes zero to both.
DMFI takes simple moving averages of the positive and negative series over MFI Length, divides the positive average by the negative average, and converts that ratio using 100 × ratio / (1 + ratio). A second SMA, controlled by MFI Smoothing, produces the displayed line.
This implementation uses close × volume for flow magnitude and HLC3 changes for direction. It should not be assumed to match another MFI implementation exactly. It classifies price-and-volume data; it does not measure actual buyer-initiated versus seller-initiated transactions.
Reading the colours
At the default settings, readings at or below 35 use teal and readings at or above 65 use pink. Between those thresholds and 50, the oscillator colour fades toward the chart background. The main-chart candles use this same colour function, so their colour reflects DMFI rather than whether each candle closed above or below its open.
The fill is pink above 50 and teal below 50. These are the indicator's extreme-oriented colours: pink does not automatically mean price is falling, and teal does not automatically mean price is rising. The centerline remains fixed at 50; “dynamic” describes its changing colour, not a moving level or an adaptive lookback.
Understanding the reversal markers
The alert and marker names use “Bullish Reversal” and “Bearish Reversal,” but the conditions identify entry into an extreme zone. They do not wait for the oscillator to leave that zone or for price to confirm a reversal.
Bullish Reversal — teal upward triangle
DMFI is strictly below the selected oversold threshold, and each of the previous two bars was at or above that threshold. With defaults, this means a reading below 35 after two readings of 35 or higher.
Bearish Reversal — pink downward triangle
DMFI is strictly above the selected overbought threshold, and each of the previous two bars was at or below that threshold. With defaults, this means a reading above 65 after two readings of 65 or lower.
The triangles appear at the bottom or top of the indicator pane. A reading exactly on a threshold does not trigger a new marker. Remaining inside an extreme zone does not generate another marker on every bar; the two preceding bars must satisfy the reset condition before another entry can qualify.
Settings
- MFI Length — 30: The lookback for positive and negative money-flow averages.
- MFI Smoothing — 4: The SMA length applied to the raw oscillator. More smoothing generally reduces short-term movement while adding lag.
- Oversold Level — 35 / Overbought Level — 65: Set the thresholds used by marker conditions, alerts, and oscillator/candle colours. Available ranges are 1–49 and 51–99.
- Bullish / Bearish colours: Customize the oscillator extremes, markers, candle colours, centerline gradient, and trend fill.
- Neutral Color: Sets the subtle background colour between the reference lines.
- Show Reversal Signals: Shows or hides the triangles. Hiding them does not disable the alert conditions.
- Show Extreme Zone Background: Toggles the background between the fixed 35 and 65 reference lines. Despite the input name, this is the middle band, not the areas outside it.
Current-version details
The horizontal reference lines and their background remain fixed at 35 and 65 when the threshold inputs change. Custom thresholds still affect signals, alerts, and colours. The Trend Smoothing input calculates an internal series that is not displayed or used by the signals. Show Dynamic Trend Fill is present in the inputs but is not connected to the fill in this version, so switching it off does not hide that shading.
Alerts and live-bar behaviour
Create a TradingView alert and select DMFI Bullish Reversal or DMFI Bearish Reversal. The supplied messages include the symbol, timeframe, and price placeholders. For notifications based on completed candles, select Once Per Bar Close.
The current reading, colour, and marker can change as live price and volume update. A condition visible during a bar can disappear before its close. Extreme readings can persist during a strong move, so markers are conditions to review alongside price structure rather than standalone entry instructions.
Data and scope
DMFI depends on the volume supplied by the chart's data feed. Missing volume or a zero average negative-flow value can produce unavailable readings because this version does not explicitly handle the division edge cases. Allow enough history for the lookback and smoothing to initialize.
This indicator provides chart analysis and alert conditions. It does not execute trades, calculate strategy performance, or supply stop-loss and take-profit orders. The examples illustrate its behaviour and are not performance results.
Free and open source
Published by SMRT Algo with source code available under the Mozilla Public License 2.0, so users can inspect the calculation, understand the conditions, and study how the visuals are built.

Get access: smrtalgo.com
Join our Discord: discord.com/invite/f7gVrMPkaC
All content provided by SMRT Algo is for informational & educational purposes only. Past performance does not guarantee future results.
Join our Discord: discord.com/invite/f7gVrMPkaC
All content provided by SMRT Algo is for informational & educational purposes only. Past performance does not guarantee future results.
免責事項
これらの情報および投稿は、TradingViewが提供または承認する金融、投資、取引、またはその他の種類の助言もしくは推奨であることを意図したものではなく、またこれらに該当するものでもありません。詳細は利用規約をご覧ください。
Get access: smrtalgo.com
Join our Discord: discord.com/invite/f7gVrMPkaC
All content provided by SMRT Algo is for informational & educational purposes only. Past performance does not guarantee future results.
Join our Discord: discord.com/invite/f7gVrMPkaC
All content provided by SMRT Algo is for informational & educational purposes only. Past performance does not guarantee future results.
免責事項
これらの情報および投稿は、TradingViewが提供または承認する金融、投資、取引、またはその他の種類の助言もしくは推奨であることを意図したものではなく、またこれらに該当するものでもありません。詳細は利用規約をご覧ください。