FishStoc
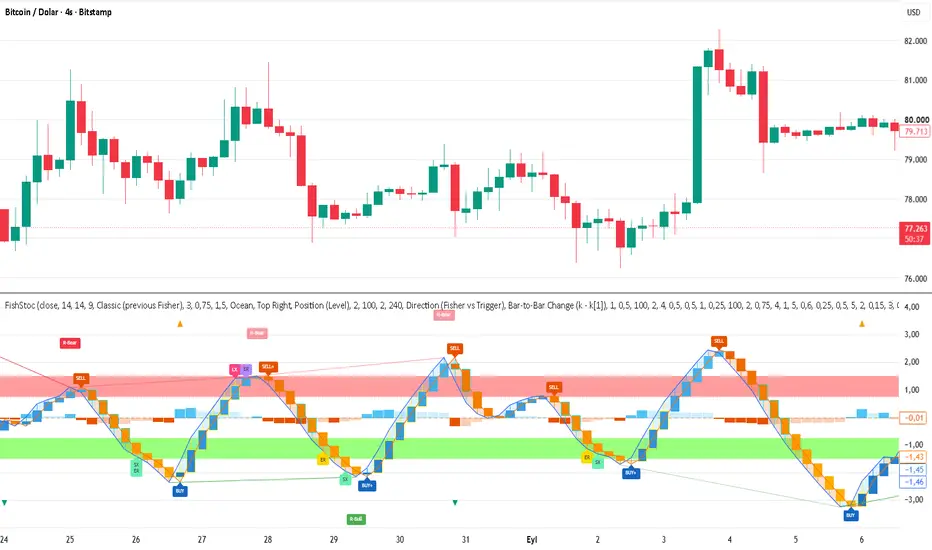
FishStoc - Fisher Stochastic RSI Momentum Candles
What it is
FishStoc applies the Fisher Transform to Stochastic RSI and draws the result as synthetic Heikin-Ashi-style candles built from the Fisher line and its Trigger line. The candles are NOT price candles. Around them the script adds a momentum histogram, acceleration, overbought/oversold bands, Fisher/Trigger cross labels, exhaustion and early-reversal markers, pivot-based regular/hidden divergence, an optional higher-timeframe filter and an optional dashboard.
Credits
Concept: “Stochastic RSI + Heikin-Ashi” (Stocashi) by CoffeeshopCrypto. FishStoc is an independent, extended re-work.
Fisher Transform: John Ehlers
Stochastic RSI: Tushar Chande and Stanley Kroll
RSI: J. Welles Wilder; Stochastic: George Lane
What problem does it address?
Stochastic RSI is bounded, saturates at the extremes and turns noisily. The Fisher Transform stretches the distribution and sharpens turning points.
Raw Fisher/Trigger crosses are frequent. Synthetic candles smooth the Fisher/Trigger pair so direction can be read at a glance.
A cross alone arrives late. Momentum, acceleration, exhaustion and early-reversal layers show when a move is losing fuel before the cross.
Zone filtering and divergence help separate crosses from stretched conditions from crosses in the middle of nowhere.
How it works
RSI -> Stochastic of RSI -> normalised to 0..1 over the Fisher Normalization Length -> Fisher Transform (k).
Trigger (d) is either the previous Fisher value (Classic, Ehlers) or an EMA of Fisher (Smoothed).
Candles: open = average of previous k and d, close = average of current k and d.
Momentum = bar-to-bar change of k (or k - d). Acceleration = change of momentum. Both are scaled by their own standard deviation.
Reading the chart
Candle colour: blue/cyan family = Fisher above its trigger side, orange/amber family = below. Colour mode can be Position (level), Momentum or Speedometer.
Histogram: solid tone = momentum strengthening, faded tone = weakening.
Yellow/cyan candle border and wick: momentum intensity above the threshold.
Triangles: strong acceleration / deceleration.
BUY / SELL labels: Fisher crosses its Trigger on a confirmed bar. By default only crosses from the overbought/oversold zone are shown.
BUY+ / SELL+: the cross followed an early-reversal or opposite-exhaustion signal within the confluence window.
LX / SX: long / short exhaustion. Fisher is stretched, momentum still points the same way but is decelerating and has faded from its recent peak. This is a warning that the move is tiring, not a reversal signal by itself.
ER: early reversal. Fisher touched an extreme zone recently, has not crossed its Trigger, and acceleration has turned toward the reversal for several bars.
R-Bull / R-Bear: regular divergence (possible reversal). H-Bull / H-Bear: hidden divergence (possible continuation).
Main settings
Core: RSI Length, Stochastic Length, Fisher Normalization Length.
Trigger Line: Classic or Smoothed (EMA length).
Zones: Inner level (default 0.75) and Outer level (default 1.5).
Theme and visuals: colour theme, candle colour mode, optional extreme-zone background (off by default), fill, dashboard (off by default).
Higher-Timeframe Filter: requires a bullish HTF bias for BUY and a bearish one for SELL, using the last confirmed HTF bar (no repaint).
Momentum / Acceleration: smoothing, auto or manual scaling, border threshold. The acceleration line is off by default; acceleration remains visible through histogram tone, triangles and the Data Window.
Exhaustion: zone level, peak lookback, fade ratio.
Early Reversal: zone level, zone-touch lookback, confirmation bars, minimum acceleration intensity.
Confluence: BUY+/SELL+ upgrade and window length.
Cross labels: cross filter (zones only or all crosses), signal cooldown.
Divergence: regular/hidden toggles, pivot left/right bars, min/max bars between pivots, minimum Fisher difference between pivots, optional zone-only pivots, connecting lines.
Suggested use by timeframe
1-5 min: noisy. Use Smoothed trigger, a cooldown of 3-5 bars and the zone filter. Use a 15m-1h HTF filter.
15 min - 1 hour: balanced for the default settings. A 4h HTF filter works well.
4 hour - Daily: fewer, slower and more pronounced signals. Divergences are most meaningful here. Use Daily or Weekly as the HTF.
A practical order of reading: higher-timeframe bias first, then zone and divergence context, then the cross label as confirmation.
Notes and limitations
Cross, exhaustion and early-reversal signals are evaluated on confirmed bars only and do not repaint. Divergences are confirmed after the pivot right-bar count; the label is drawn on the pivot bar and does not move afterwards. Price in the divergence check is read from the high/low of the oscillator pivot bar.
In strong trends the oscillator can stay in the extreme zones for a long time. An exhaustion or cross signal does not guarantee a reversal.
Alerts are available for divergences, BUY/SELL, BUY+/SELL+, zone entries, zero-line crosses, exhaustion and early reversal.
Disclaimer
This script is for educational and analytical purposes only. It is not financial advice and does not guarantee any result. Past behaviour does not predict future performance. Test any idea on your own and manage your risk.
What it is
FishStoc applies the Fisher Transform to Stochastic RSI and draws the result as synthetic Heikin-Ashi-style candles built from the Fisher line and its Trigger line. The candles are NOT price candles. Around them the script adds a momentum histogram, acceleration, overbought/oversold bands, Fisher/Trigger cross labels, exhaustion and early-reversal markers, pivot-based regular/hidden divergence, an optional higher-timeframe filter and an optional dashboard.
Credits
Concept: “Stochastic RSI + Heikin-Ashi” (Stocashi) by CoffeeshopCrypto. FishStoc is an independent, extended re-work.
Fisher Transform: John Ehlers
Stochastic RSI: Tushar Chande and Stanley Kroll
RSI: J. Welles Wilder; Stochastic: George Lane
What problem does it address?
Stochastic RSI is bounded, saturates at the extremes and turns noisily. The Fisher Transform stretches the distribution and sharpens turning points.
Raw Fisher/Trigger crosses are frequent. Synthetic candles smooth the Fisher/Trigger pair so direction can be read at a glance.
A cross alone arrives late. Momentum, acceleration, exhaustion and early-reversal layers show when a move is losing fuel before the cross.
Zone filtering and divergence help separate crosses from stretched conditions from crosses in the middle of nowhere.
How it works
RSI -> Stochastic of RSI -> normalised to 0..1 over the Fisher Normalization Length -> Fisher Transform (k).
Trigger (d) is either the previous Fisher value (Classic, Ehlers) or an EMA of Fisher (Smoothed).
Candles: open = average of previous k and d, close = average of current k and d.
Momentum = bar-to-bar change of k (or k - d). Acceleration = change of momentum. Both are scaled by their own standard deviation.
Reading the chart
Candle colour: blue/cyan family = Fisher above its trigger side, orange/amber family = below. Colour mode can be Position (level), Momentum or Speedometer.
Histogram: solid tone = momentum strengthening, faded tone = weakening.
Yellow/cyan candle border and wick: momentum intensity above the threshold.
Triangles: strong acceleration / deceleration.
BUY / SELL labels: Fisher crosses its Trigger on a confirmed bar. By default only crosses from the overbought/oversold zone are shown.
BUY+ / SELL+: the cross followed an early-reversal or opposite-exhaustion signal within the confluence window.
LX / SX: long / short exhaustion. Fisher is stretched, momentum still points the same way but is decelerating and has faded from its recent peak. This is a warning that the move is tiring, not a reversal signal by itself.
ER: early reversal. Fisher touched an extreme zone recently, has not crossed its Trigger, and acceleration has turned toward the reversal for several bars.
R-Bull / R-Bear: regular divergence (possible reversal). H-Bull / H-Bear: hidden divergence (possible continuation).
Main settings
Core: RSI Length, Stochastic Length, Fisher Normalization Length.
Trigger Line: Classic or Smoothed (EMA length).
Zones: Inner level (default 0.75) and Outer level (default 1.5).
Theme and visuals: colour theme, candle colour mode, optional extreme-zone background (off by default), fill, dashboard (off by default).
Higher-Timeframe Filter: requires a bullish HTF bias for BUY and a bearish one for SELL, using the last confirmed HTF bar (no repaint).
Momentum / Acceleration: smoothing, auto or manual scaling, border threshold. The acceleration line is off by default; acceleration remains visible through histogram tone, triangles and the Data Window.
Exhaustion: zone level, peak lookback, fade ratio.
Early Reversal: zone level, zone-touch lookback, confirmation bars, minimum acceleration intensity.
Confluence: BUY+/SELL+ upgrade and window length.
Cross labels: cross filter (zones only or all crosses), signal cooldown.
Divergence: regular/hidden toggles, pivot left/right bars, min/max bars between pivots, minimum Fisher difference between pivots, optional zone-only pivots, connecting lines.
Suggested use by timeframe
1-5 min: noisy. Use Smoothed trigger, a cooldown of 3-5 bars and the zone filter. Use a 15m-1h HTF filter.
15 min - 1 hour: balanced for the default settings. A 4h HTF filter works well.
4 hour - Daily: fewer, slower and more pronounced signals. Divergences are most meaningful here. Use Daily or Weekly as the HTF.
A practical order of reading: higher-timeframe bias first, then zone and divergence context, then the cross label as confirmation.
Notes and limitations
Cross, exhaustion and early-reversal signals are evaluated on confirmed bars only and do not repaint. Divergences are confirmed after the pivot right-bar count; the label is drawn on the pivot bar and does not move afterwards. Price in the divergence check is read from the high/low of the oscillator pivot bar.
In strong trends the oscillator can stay in the extreme zones for a long time. An exhaustion or cross signal does not guarantee a reversal.
Alerts are available for divergences, BUY/SELL, BUY+/SELL+, zone entries, zero-line crosses, exhaustion and early reversal.
Disclaimer
This script is for educational and analytical purposes only. It is not financial advice and does not guarantee any result. Past behaviour does not predict future performance. Test any idea on your own and manage your risk.

免責事項
これらの情報および投稿は、TradingViewが提供または承認する金融、投資、取引、またはその他の種類の助言もしくは推奨であることを意図したものではなく、またこれらに該当するものでもありません。詳細は利用規約をご覧ください。
免責事項
これらの情報および投稿は、TradingViewが提供または承認する金融、投資、取引、またはその他の種類の助言もしくは推奨であることを意図したものではなく、またこれらに該当するものでもありません。詳細は利用規約をご覧ください。