OPEN-SOURCE SCRIPT
更新済 Kale Dashboard
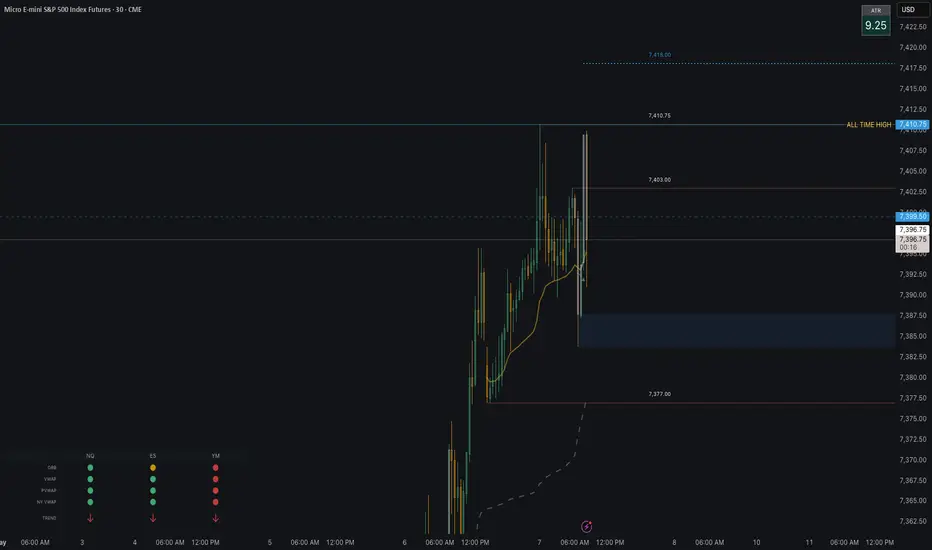
a dashboard on your chart showing gold, nasdaq, spy, meta, apple, nividia and YM. it shows whether they are above or below the 15m orb
リリースノート
shows the orb for top instruments. gives you an idea of trend for the dayリリースノート
Dashboard showing the instruments that coordinate. The top row shows when that instrument is either above below or in the 15M session ORB. The middle row show whether is it above or below its session vwap. The last row shows what the trend is doing using the 5M chart for reference. リリースノート
You now have options to include or take away an instrument and choose the color of the table. last but not least, more location options of the box. リリースノート
you can now change the color of everything. i have also included more instruments and location options. オープンソーススクリプト
TradingViewの精神に則り、このスクリプトの作者はコードをオープンソースとして公開してくれました。トレーダーが内容を確認・検証できるようにという配慮です。作者に拍手を送りましょう!無料で利用できますが、コードの再公開はハウスルールに従う必要があります。

免責事項
これらの情報および投稿は、TradingViewが提供または承認する金融、投資、取引、またはその他の種類の助言もしくは推奨であることを意図したものではなく、またこれらに該当するものでもありません。詳細は利用規約をご覧ください。
オープンソーススクリプト
TradingViewの精神に則り、このスクリプトの作者はコードをオープンソースとして公開してくれました。トレーダーが内容を確認・検証できるようにという配慮です。作者に拍手を送りましょう!無料で利用できますが、コードの再公開はハウスルールに従う必要があります。
免責事項
これらの情報および投稿は、TradingViewが提供または承認する金融、投資、取引、またはその他の種類の助言もしくは推奨であることを意図したものではなく、またこれらに該当するものでもありません。詳細は利用規約をご覧ください。