OPEN-SOURCE SCRIPT
更新済 Hourly Inflection Levels/ pivot points
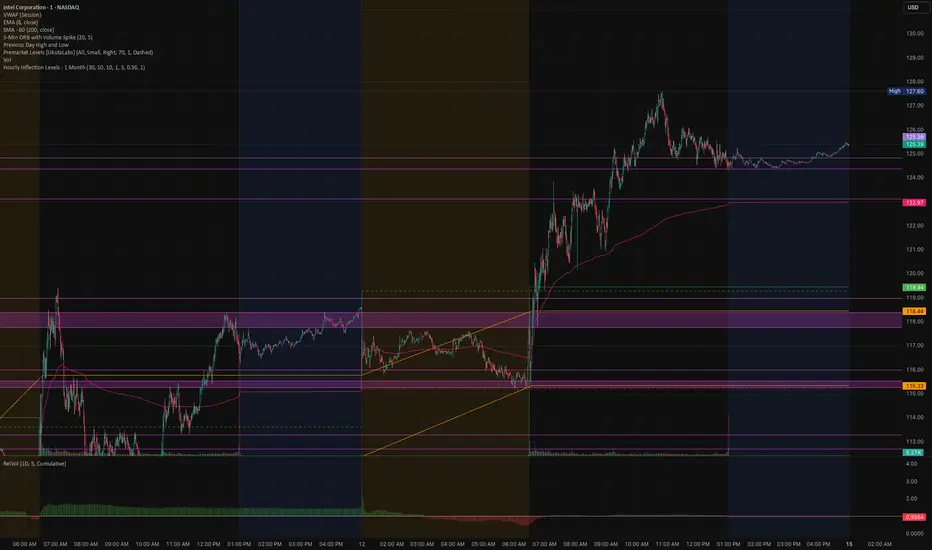
This indicator finds the price levels where the hourly chart has repeatedly turned, and draws them as support/resistance zones — regardless of what timeframe your chart is on. It pulls 1-hour data via request.security, so the same zones appear whether you're viewing a 5-minute, 1-hour, or 4-hour chart.
How it works
1. Pivot detection. On the hourly series it locates two kinds of turning points:
Wick pivots — pivot highs/lows based on candle high/low (where price actually reached).
Body pivots — pivot highs/lows based on max(open, close) / min(open, close) (where price closed the swing).
2. Intensity filter. Each pivot is scored by how far price travelled inside its pivot window (the displacement between the pivot and the opposite extreme). Weak, shallow pivots are discarded via the Min Inflection Intensity threshold, so only meaningful inflections survive.
3. Cross-type merging into zones. Every qualified pivot — wick or body, high or low — is pooled together, sorted by price, and merged: any pivots within the Merge / Zone Tolerance of each other collapse into a single zone. The zone's boundaries become the highest and lowest merged price; each merge adds one to the zone's touch count, and the zone keeps the strongest intensity of its members.
4. Display. Zones that have been touched at least Min Touch Count times are drawn as boxes, optionally extended to the right, with a label showing the level's mid-price, touch count, and intensity %. Levels touched fewer times are hidden.
Inputs
Lookback Period — how many days of hourly history to scan (rolling window; old levels are pruned automatically).
Pivot Left/Right Bars — sensitivity of pivot detection.
Min Touch Count — how many pivots must fall in a zone for it to be shown.
Min Inflection Intensity — minimum swing strength for a pivot to count.
Merge / Zone Tolerance — how close pivots must be to merge into one zone.
Wick / Body toggles — choose which pivot types feed the zones.
Display — extend zones right, show labels, zone color, border width.
Reading the zones
A zone with a high touch count and high intensity marks a price area the market has reacted to strongly and repeatedly over the past month — prime candidates for support, resistance, and reaction levels.
Note: Zones are confluence levels built from past hourly pivots, not signals. They don't repaint historically (pivots are confirmed), but the active set updates as new hourly bars form and old ones age out of the lookback window.
How it works
1. Pivot detection. On the hourly series it locates two kinds of turning points:
Wick pivots — pivot highs/lows based on candle high/low (where price actually reached).
Body pivots — pivot highs/lows based on max(open, close) / min(open, close) (where price closed the swing).
2. Intensity filter. Each pivot is scored by how far price travelled inside its pivot window (the displacement between the pivot and the opposite extreme). Weak, shallow pivots are discarded via the Min Inflection Intensity threshold, so only meaningful inflections survive.
3. Cross-type merging into zones. Every qualified pivot — wick or body, high or low — is pooled together, sorted by price, and merged: any pivots within the Merge / Zone Tolerance of each other collapse into a single zone. The zone's boundaries become the highest and lowest merged price; each merge adds one to the zone's touch count, and the zone keeps the strongest intensity of its members.
4. Display. Zones that have been touched at least Min Touch Count times are drawn as boxes, optionally extended to the right, with a label showing the level's mid-price, touch count, and intensity %. Levels touched fewer times are hidden.
Inputs
Lookback Period — how many days of hourly history to scan (rolling window; old levels are pruned automatically).
Pivot Left/Right Bars — sensitivity of pivot detection.
Min Touch Count — how many pivots must fall in a zone for it to be shown.
Min Inflection Intensity — minimum swing strength for a pivot to count.
Merge / Zone Tolerance — how close pivots must be to merge into one zone.
Wick / Body toggles — choose which pivot types feed the zones.
Display — extend zones right, show labels, zone color, border width.
Reading the zones
A zone with a high touch count and high intensity marks a price area the market has reacted to strongly and repeatedly over the past month — prime candidates for support, resistance, and reaction levels.
Note: Zones are confluence levels built from past hourly pivots, not signals. They don't repaint historically (pivots are confirmed), but the active set updates as new hourly bars form and old ones age out of the lookback window.
リリースノート
This indicator finds the price levels where the hourly chart has repeatedly turned, and draws them as support/resistance zones — regardless of what timeframe your chart is on. It pulls 1-hour data via request.security, so the same zones appear whether you're viewing a 5-minute, 1-hour, or 4-hour chart.How it works
1. Pivot detection. On the hourly series it locates two kinds of turning points:
Wick pivots — pivot highs/lows based on candle high/low (where price actually reached).
Body pivots — pivot highs/lows based on max(open, close) / min(open, close) (where price closed the swing).
2. Intensity filter. Each pivot is scored by how far price travelled inside its pivot window (the displacement between the pivot and the opposite extreme). Weak, shallow pivots are discarded via the Min Inflection Intensity threshold, so only meaningful inflections survive.
3. Cross-type merging into zones. Every qualified pivot — wick or body, high or low — is pooled together, sorted by price, and merged: any pivots within the Merge / Zone Tolerance of each other collapse into a single zone. The zone's boundaries become the highest and lowest merged price; each merge adds one to the zone's touch count, and the zone keeps the strongest intensity of its members.
4. Display. Zones that have been touched at least Min Touch Count times are drawn as boxes, optionally extended to the right, with a label showing the level's mid-price, touch count, and intensity %. Levels touched fewer times are hidden.
Inputs
Lookback Period — how many days of hourly history to scan (rolling window; old levels are pruned automatically).
Pivot Left/Right Bars — sensitivity of pivot detection.
Min Touch Count — how many pivots must fall in a zone for it to be shown.
Min Inflection Intensity — minimum swing strength for a pivot to count.
Merge / Zone Tolerance — how close pivots must be to merge into one zone.
Wick / Body toggles — choose which pivot types feed the zones.
Display — extend zones right, show labels, zone color, border width.
Reading the zones
A zone with a high touch count and high intensity marks a price area the market has reacted to strongly and repeatedly over the past month — prime candidates for support, resistance, and reaction levels.
Note: Zones are confluence levels built from past hourly pivots, not signals. They don't repaint historically (pivots are confirmed), but the active set updates as new hourly bars form and old ones age out of the lookback window.
リリースノート
Change include option to auto calcuate the intensity threshold based on ATR of a tickrオープンソーススクリプト
TradingViewの精神に則り、このスクリプトの作者はコードをオープンソースとして公開してくれました。トレーダーが内容を確認・検証できるようにという配慮です。作者に拍手を送りましょう!無料で利用できますが、コードの再公開はハウスルールに従う必要があります。

免責事項
これらの情報および投稿は、TradingViewが提供または承認する金融、投資、取引、またはその他の種類の助言もしくは推奨であることを意図したものではなく、またこれらに該当するものでもありません。詳細は利用規約をご覧ください。
オープンソーススクリプト
TradingViewの精神に則り、このスクリプトの作者はコードをオープンソースとして公開してくれました。トレーダーが内容を確認・検証できるようにという配慮です。作者に拍手を送りましょう!無料で利用できますが、コードの再公開はハウスルールに従う必要があります。
免責事項
これらの情報および投稿は、TradingViewが提供または承認する金融、投資、取引、またはその他の種類の助言もしくは推奨であることを意図したものではなく、またこれらに該当するものでもありません。詳細は利用規約をご覧ください。