Kivra Liquidity Nodes [JOAT]
Kivra Liquidity Nodes [JOAT]
Introduction
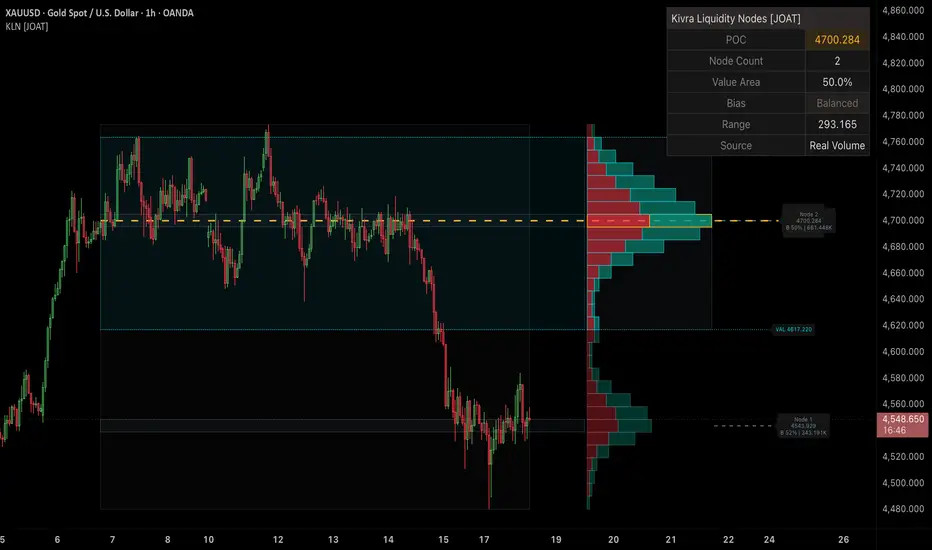
Kivra Liquidity Nodes is an open-source right-edge volume profile that finds high-participation price areas inside a configurable lookback window. It distributes each bar's volume across price rows, smooths the result, highlights the point of control, and labels local liquidity nodes.
The problem it solves is volume context. A raw profile can show where trading occurred, but it often becomes visually heavy. Kivra Liquidity Nodes keeps the profile compact, separates bullish and bearish participation estimates, and prioritizes POC, value area, and node labels. The profile is offset to the right of price, while the lookback range and value area remain visible on the active chart so the levels have context.

Core Concepts
1. Price-Overlap Volume Allocation
Each bar contributes volume to every row it overlaps. This makes the profile more representative than assigning all volume to a single close price.
2. Participation Split
The script estimates bullish and bearish participation from candle direction and close location inside the bar range. This is a proxy designed for visual context, not bid/ask delta.
3. Smoothed Node Detection
Profile rows are smoothed with neighboring rows. Local peaks above an average-volume threshold become liquidity nodes.
4. Value Area Expansion
The value area expands from the POC until the selected portion of total profile volume is covered.
5. Context Bands and Candle Tinting
The script shades the full lookback range, marks the value area across the live price region, draws node bands across the profiled window, prints VAH/VAL and POC labels far to the right of the profile to avoid overlap, and can tint candles using a pressure blend from trend location and candle direction.
Features
Input Parameters
Calculation:
How to Use This Indicator
Step 1: Use the POC as the dominant participation level in the current lookback.
Step 2: Use the value area to understand where volume is concentrated.
Step 3: Watch VAH and VAL as acceptance/rejection boundaries.
Step 4: Watch labeled nodes as potential reaction or acceptance zones.
Step 5: Read the dashboard bias and candle tint as context, not as standalone entry signals.
Indicator Limitations
Originality Statement
Kivra Liquidity Nodes is original in its compact right-edge implementation combining overlap-based volume allocation, smoothed node detection, value area expansion, participation split visualization, and no-volume fallback logic. It does not copy third-party source code.
Disclaimer
This open-source indicator is provided for educational and informational purposes only. It is not financial advice. Volume nodes identify historical participation zones and do not guarantee future reactions.
-Made with passion by jackofalltrades
Introduction
Kivra Liquidity Nodes is an open-source right-edge volume profile that finds high-participation price areas inside a configurable lookback window. It distributes each bar's volume across price rows, smooths the result, highlights the point of control, and labels local liquidity nodes.
The problem it solves is volume context. A raw profile can show where trading occurred, but it often becomes visually heavy. Kivra Liquidity Nodes keeps the profile compact, separates bullish and bearish participation estimates, and prioritizes POC, value area, and node labels. The profile is offset to the right of price, while the lookback range and value area remain visible on the active chart so the levels have context.
Core Concepts
1. Price-Overlap Volume Allocation
Each bar contributes volume to every row it overlaps. This makes the profile more representative than assigning all volume to a single close price.
2. Participation Split
The script estimates bullish and bearish participation from candle direction and close location inside the bar range. This is a proxy designed for visual context, not bid/ask delta.
3. Smoothed Node Detection
Profile rows are smoothed with neighboring rows. Local peaks above an average-volume threshold become liquidity nodes.
4. Value Area Expansion
The value area expands from the POC until the selected portion of total profile volume is covered.
5. Context Bands and Candle Tinting
The script shades the full lookback range, marks the value area across the live price region, draws node bands across the profiled window, prints VAH/VAL and POC labels far to the right of the profile to avoid overlap, and can tint candles using a pressure blend from trend location and candle direction.
Features
- Right-edge profile: Clean horizontal profile projected to the right of the chart
- POC line and label: Dashed level marking the highest-volume row
- POC line and label: Dashed level marking the highest-volume row with price and row volume
- VAH and VAL labels: Right-edge value-area high and low labels with dotted guide lines
- Value area boxes: Shaded profile zone plus live-chart value band across the lookback
- Lookback range box: Subtle range boundary around the profiled window
- Bull/bear split bars: Row coloring estimates directional participation
- Node labels: Local high-volume nodes with participation share and volume
- Node bands: High-participation node rows project back across the profiled price window
- Offset label rail: POC, VAH/VAL, and node labels are projected beyond the histogram so they do not sit on top of the profile
- Pressure candle tint: Candles can be softly colored from bearish red to bullish green using trend location and candle direction
- No-volume fallback: Uses range proxy when reliable volume is not available
- Top-right dashboard: POC, node count, value area width, bias, range, and source
Input Parameters
Calculation:
- Lookback Bars: Historical bars used for the profile
- Profile Rows: Vertical resolution of the profile
- Profile Width: Maximum right-edge width
- Profile Offset: Distance from current bar to the profile
- Value Area Portion: Portion of total profile volume included in value area
- Node Threshold: Required row strength for node detection
- Node Merge Gap: Distance allowed between merged node peaks
- Max Node Labels: Maximum labels drawn for detected nodes
How to Use This Indicator
Step 1: Use the POC as the dominant participation level in the current lookback.
Step 2: Use the value area to understand where volume is concentrated.
Step 3: Watch VAH and VAL as acceptance/rejection boundaries.
Step 4: Watch labeled nodes as potential reaction or acceptance zones.
Step 5: Read the dashboard bias and candle tint as context, not as standalone entry signals.
Indicator Limitations
- Bull/bear participation is an estimate based on candle structure, not exchange bid/ask data
- The profile is recalculated on the latest bar and depends on the selected lookback
- High node count can add visual density on small screens
- Volume data quality varies by market and symbol
Originality Statement
Kivra Liquidity Nodes is original in its compact right-edge implementation combining overlap-based volume allocation, smoothed node detection, value area expansion, participation split visualization, and no-volume fallback logic. It does not copy third-party source code.
Disclaimer
This open-source indicator is provided for educational and informational purposes only. It is not financial advice. Volume nodes identify historical participation zones and do not guarantee future reactions.
-Made with passion by jackofalltrades

The Institutional Grade Trading Ecosystem, Built to win trades 📈
Get Access 👇
jackofalltrades.vip 🌐
t.me/jackofalltradesvip 🃏
Get Access 👇
jackofalltrades.vip 🌐
t.me/jackofalltradesvip 🃏
免責事項
これらの情報および投稿は、TradingViewが提供または承認する金融、投資、取引、またはその他の種類の助言もしくは推奨であることを意図したものではなく、またこれらに該当するものでもありません。詳細は利用規約をご覧ください。
The Institutional Grade Trading Ecosystem, Built to win trades 📈
Get Access 👇
jackofalltrades.vip 🌐
t.me/jackofalltradesvip 🃏
Get Access 👇
jackofalltrades.vip 🌐
t.me/jackofalltradesvip 🃏
免責事項
これらの情報および投稿は、TradingViewが提供または承認する金融、投資、取引、またはその他の種類の助言もしくは推奨であることを意図したものではなく、またこれらに該当するものでもありません。詳細は利用規約をご覧ください。