Market Structure Map [JOAT]
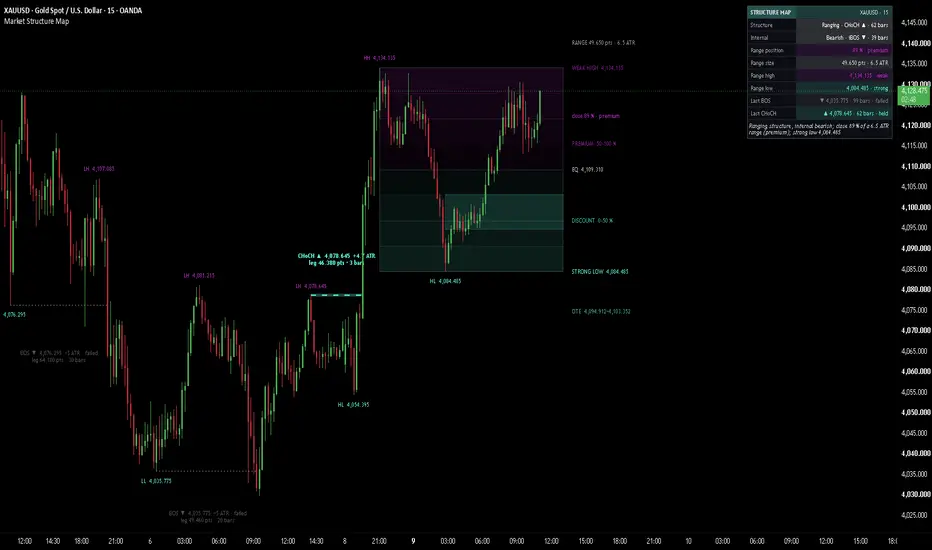
Market Structure Map is an open-source structure reader that draws swing structure at two scales, labels every break with the numbers behind it, and maps the current dealing range into premium and discount. Every confirmed swing is tagged with its class and price, every break of structure carries its level, the size of the leg that produced it and how long that leg took, and the right edge of the chart reads the range back as short data tags: the strong or weak high and low with their prices, the range size, the equilibrium, the premium and discount halves, and where the close sits inside the range.
The premise is simple: structure is the order in which highs and lows are made and broken. A close through the last swing high or low is a structural event, the extremes of the current leg define a dealing range, and the position of price inside that range is a number. This indicator measures those things and draws them cleanly. It does not give buy or sell signals, entries or targets.
Core Concepts
1. Two Scales of Structure
Swing pivots (default 12 bars on each side) define the main structure; internal pivots (default 4) define the small legs inside it. Internal structure is computed all the time for the dashboard but drawn only when you turn it on, so a 5m or 1m chart stays clean by default. A pivot only counts once the bars to its right have closed, so the tags never move. Highs are tagged H / HH / LH above the candle in the bear colour, lows L / HL / LL below the candle in the bull colour, with the price on every swing tag.
2. BOS and CHoCH
A confirmed close through the last swing high or low is a structural event. If it goes the same way as the current structure it is a BOS (break of structure); if it goes against it, it is a CHoCH (change of character). Only closes count, never wicks:
Pine Script®
Each swing event is a line from the broken swing to the break bar with a data tag, for example "BOS ▲ 24,550.25 +1.2 ATR" over "leg 86 pts · 23 bars". A CHoCH is drawn dashed with its own word in bold. Internal events, when switched on, are thin lines with a readable one-line tag ("iBOS ▲ +0.6 ATR"), and only the last four are kept. The freshest swing event glows; older ones dim; a break that price later closes back through turns grey and dotted and its tag says "failed".
3. Dealing Range, Premium and Discount
The dealing range runs from the last swing low to the last swing high, trailed to any newer extreme printed since. Its upper half (premium) is tinted in the bear colour and its lower half (discount) in the bull colour, both fading toward the dotted equilibrium. The close's position is a plain percentage of the range: 0 % at the range low, 100 % at the range high.
4. Strong and Weak Extremes
Using the standard naming: the extreme the latest break leg started from is the strong one (structure defends it, a close beyond it would be a change of character); the opposite extreme, the one the leg ran to, is the weak one. In bullish structure the range low is strong and the range high weak; in bearish structure the reverse.
5. Optional OTE Band
When enabled, a faint dotted stripe marks the 62-79 % retracement of the dealing range measured from the latest extreme: inside discount when structure is bullish, inside premium when it is bearish. It is a zone to read, not a signal.
Features
Input Parameters
Structure:
Labels:
Dealing range:
Theme, Limits, Dashboard, Candles:
How to Use This Indicator
Reading the structure
The dashboard's Structure row gives the swing bias from the last two swing events: two in the same direction is a trend, opposite directions read as ranging. The Internal row gives the same reading on the small legs; when it disagrees with the swing structure the value turns the accent colour, which is how a pullback inside a larger leg looks.
Reading the events
A solid line with a BOS tag is a break in the direction of the structure; a dashed line with a bold CHoCH tag is the first break against it. The ATR figure tells how large the leg behind the break was relative to normal volatility, and the points and bars line tells how far and how fast it travelled. A grey dotted line marked "failed" is a break price has since closed back through.
Reading the range
The right edge lists the range high and low by their strong / weak state (STRONG HIGH, WEAK LOW and so on) with their prices, the range size just above the high, the equilibrium price, and the premium and discount halves. The close tag gives the close's percentage of the range and its zone; hover it, or the EQ tag, for the distance from equilibrium in ATR, and hover PREMIUM or DISCOUNT for the band prices. A small range (a couple of ATR) puts premium and discount close together; a tall range separates them clearly.
Indicator Limitations
Originality Statement
Disclaimer
This indicator is provided for educational and informational purposes only. It is not financial advice. Trading involves substantial risk of loss. Structure events, ranges and zones drawn by this indicator describe past price behaviour and are not predictions of future price behaviour. The author accepts no responsibility for trading losses resulting from use of this indicator.
Made with passion by jackofalltrades
The premise is simple: structure is the order in which highs and lows are made and broken. A close through the last swing high or low is a structural event, the extremes of the current leg define a dealing range, and the position of price inside that range is a number. This indicator measures those things and draws them cleanly. It does not give buy or sell signals, entries or targets.
Core Concepts
1. Two Scales of Structure
Swing pivots (default 12 bars on each side) define the main structure; internal pivots (default 4) define the small legs inside it. Internal structure is computed all the time for the dashboard but drawn only when you turn it on, so a 5m or 1m chart stays clean by default. A pivot only counts once the bars to its right have closed, so the tags never move. Highs are tagged H / HH / LH above the candle in the bear colour, lows L / HL / LL below the candle in the bull colour, with the price on every swing tag.
2. BOS and CHoCH
A confirmed close through the last swing high or low is a structural event. If it goes the same way as the current structure it is a BOS (break of structure); if it goes against it, it is a CHoCH (change of character). Only closes count, never wicks:
Each swing event is a line from the broken swing to the break bar with a data tag, for example "BOS ▲ 24,550.25 +1.2 ATR" over "leg 86 pts · 23 bars". A CHoCH is drawn dashed with its own word in bold. Internal events, when switched on, are thin lines with a readable one-line tag ("iBOS ▲ +0.6 ATR"), and only the last four are kept. The freshest swing event glows; older ones dim; a break that price later closes back through turns grey and dotted and its tag says "failed".
3. Dealing Range, Premium and Discount
The dealing range runs from the last swing low to the last swing high, trailed to any newer extreme printed since. Its upper half (premium) is tinted in the bear colour and its lower half (discount) in the bull colour, both fading toward the dotted equilibrium. The close's position is a plain percentage of the range: 0 % at the range low, 100 % at the range high.
4. Strong and Weak Extremes
Using the standard naming: the extreme the latest break leg started from is the strong one (structure defends it, a close beyond it would be a change of character); the opposite extreme, the one the leg ran to, is the weak one. In bullish structure the range low is strong and the range high weak; in bearish structure the reverse.
5. Optional OTE Band
When enabled, a faint dotted stripe marks the 62-79 % retracement of the dealing range measured from the latest extreme: inside discount when structure is bullish, inside premium when it is bearish. It is a zone to read, not a signal.
Features
- Two-scale structure: Swing and internal pivots, each with its own BOS / CHoCH state machine and bias
- Data inside the event tags: Break level, leg size in ATR, leg size in points and leg length in bars; the tooltip adds how far the break close sat beyond the level
- CHoCH set apart: Dashed line and a bold word, so it never reads as a BOS
- Role-coloured swing tags: Highs in the bear colour above the candle, lows in the bull colour below, price on every swing tag
- State by opacity: The freshest swing event glows, older events dim, failed breaks turn grey and say "failed"
- Gradient dealing range: Premium and discount halves fading toward the equilibrium, optional quartile lines
- Right-edge data tags: STRONG / WEAK HIGH and LOW with price, RANGE size in points and ATR, EQ with price, PREMIUM 50-100 % and DISCOUNT 0-50 %, and the close position with its zone; each tag is 28 characters at most so it fits the right margin, and its tooltip carries the band prices and the distance from EQ in ATR
- Readable everywhere: No data-carrying text is drawn smaller than the Small size
- No overlapping tags: Historical tags are stacked away from the candles when they would touch a nearby tag; right-edge tags keep a minimum gap from each other
- Clean on fast charts: Internal structure is off by default and capped at its last four events when on; visible swing events and tags are capped and retired oldest-first; the latest swing CHoCH is always kept
- Dashboard: Structure, internal structure, range position, range size, range high and low with strong / weak, last BOS and last CHoCH with level, bars ago and held / failed, and a Read line built from the numbers and wrapped so the panel stays narrow; every row has a tooltip, and every row is also drawn on the chart
- Themes: Seven presets including a black / white preset, light and dark chart awareness, all colours exposed
- Optional candle paint: Range position gradient or one mono colour
- Non-repainting: Pivots, events and historical tags are placed on confirmed bars only
- Alerts: Swing BOS up / down, swing CHoCH up / down, internal CHoCH
Input Parameters
Structure:
- Swing pivot length: Bars on each side a swing high or low must dominate (default: 12)
- Internal pivot length: The same for internal structure (default: 4)
- Show internal structure: Draw the internal iBOS / iCHoCH lines and pivot letters; the dashboard computes internal structure either way (default: off)
- Show BOS / Show CHoCH: Draw each event type (default: on)
- Swing events kept: Visible swing events (default: 10)
- Internal events kept: Visible internal events, 1 to 4 (default: 4)
- Grey out failed breaks: Breaks that price closes back through turn grey and say "failed" (default: on)
- Leg size on the tag: Adds the leg size in ATR to every event tag (default: on)
- Swing event tag: Two lines or One line (default: Two lines)
- Glow on the freshest event (default: on)
- Swing line width (default: 2)
Labels:
- Swing tags (H / L / HH / HL / LH / LL) (default: on)
- Internal tags: Letters on the internal pivots, shown only while internal structure is on (default: on)
- Price on swing tags (default: on)
- Tag size: Small, Normal or Large; internal tags are one step smaller but never below Small (default: Small)
- Label gap (ATR): Vertical room for one tag line, used to keep tags apart (default: 0.8)
Dealing range:
- Show dealing range (default: on)
- Range extension (bars): How far past the last candle the range reaches (default: 8)
- Gradient bands per half (default: 4)
- Equilibrium band (± %): Width of the equilibrium zone around 50 % (default: 5.0)
- Quartile lines (25 % / 75 %) (default: off)
- Range tags: STRONG / WEAK HIGH and LOW, RANGE size, EQ, PREMIUM and DISCOUNT tags (default: on)
- Close position tag: "close 68 % · premium" (default: on)
- OTE band (62-79 %) (default: off)
Theme, Limits, Dashboard, Candles:
- Theme: JOAT Signature, Midnight Blue / Red, Aurora Night, Delta Cyan / Pink, Paper & Ink, Lime Ember, Custom (default: JOAT Signature)
- Brightness 1-5 (default: 3) and Chart background Auto / Dark / Light (default: Auto)
- Custom colours for bull, bear, accent, neutral, text, panel and glow
- Swing tags kept (default: 24) and Internal tags kept (default: 8)
- Show dashboard, Dashboard position (default: Top Right), Dashboard size Small, Normal or Large (default: Small), Compact dashboard, Tinted value cells
- Candle paint: Off, Score or Mono (default: Off)
How to Use This Indicator
Reading the structure
The dashboard's Structure row gives the swing bias from the last two swing events: two in the same direction is a trend, opposite directions read as ranging. The Internal row gives the same reading on the small legs; when it disagrees with the swing structure the value turns the accent colour, which is how a pullback inside a larger leg looks.
Reading the events
A solid line with a BOS tag is a break in the direction of the structure; a dashed line with a bold CHoCH tag is the first break against it. The ATR figure tells how large the leg behind the break was relative to normal volatility, and the points and bars line tells how far and how fast it travelled. A grey dotted line marked "failed" is a break price has since closed back through.
Reading the range
The right edge lists the range high and low by their strong / weak state (STRONG HIGH, WEAK LOW and so on) with their prices, the range size just above the high, the equilibrium price, and the premium and discount halves. The close tag gives the close's percentage of the range and its zone; hover it, or the EQ tag, for the distance from equilibrium in ATR, and hover PREMIUM or DISCOUNT for the band prices. A small range (a couple of ATR) puts premium and discount close together; a tall range separates them clearly.
Indicator Limitations
- Pivots are confirmed only after the pivot length has closed to their right, so every swing tag appears that many bars after the high or low it marks
- Breaks need a close through the level; a wick through and back is not counted as an event
- ATR is ATR(14) on the chart timeframe; leg and range sizes in ATR change meaning across timeframes
- On a free account the chart holds about 5,000 bars, so structure starts from the first pivots inside that history; older events and tags are retired to stay within drawing limits
- Tag spacing is estimated from the character count and the ATR-based label gap; at extreme zoom levels tags can still come close, and the Label gap input spreads them further
- The right-edge tags, the range and the dashboard follow the live bar; the historical events and tags do not change once placed
- Continuous futures charts can show artificial jumps at contract rolls, which the structure reads like any other price move
Originality Statement
- Every structure event tag carries its own data (break level, leg size in ATR and points, leg duration), with change of character set apart by line style and weight rather than colour alone
- The dealing range is read back as short right-edge data tags (strong / weak extremes with price, range size, equilibrium, premium and discount, close position) with the detail in their tooltips, and every dashboard row is also drawn on the chart
- A position-aware tag register stacks historical tags away from the candles so swing tags and event tags never sit on top of each other, together with capped, oldest-first retirement that keeps the latest change of character visible
Disclaimer
This indicator is provided for educational and informational purposes only. It is not financial advice. Trading involves substantial risk of loss. Structure events, ranges and zones drawn by this indicator describe past price behaviour and are not predictions of future price behaviour. The author accepts no responsibility for trading losses resulting from use of this indicator.
Made with passion by jackofalltrades

The Proven Highest Win Rate Trading Indicators, Strategies, Tools, + Signals !! 🃏
Get Access and See Full Results👇
jackofalltrades.vip 🌐
Get Access and See Full Results👇
jackofalltrades.vip 🌐
免責事項
これらの情報および投稿は、TradingViewが提供または承認する金融、投資、取引、またはその他の種類の助言もしくは推奨であることを意図したものではなく、またこれらに該当するものでもありません。詳細は利用規約をご覧ください。
The Proven Highest Win Rate Trading Indicators, Strategies, Tools, + Signals !! 🃏
Get Access and See Full Results👇
jackofalltrades.vip 🌐
Get Access and See Full Results👇
jackofalltrades.vip 🌐
免責事項
これらの情報および投稿は、TradingViewが提供または承認する金融、投資、取引、またはその他の種類の助言もしくは推奨であることを意図したものではなく、またこれらに該当するものでもありません。詳細は利用規約をご覧ください。