OPEN-SOURCE SCRIPT
[Thies] 0DTE SPY+ES Volume, VIX1D, Volume Delta
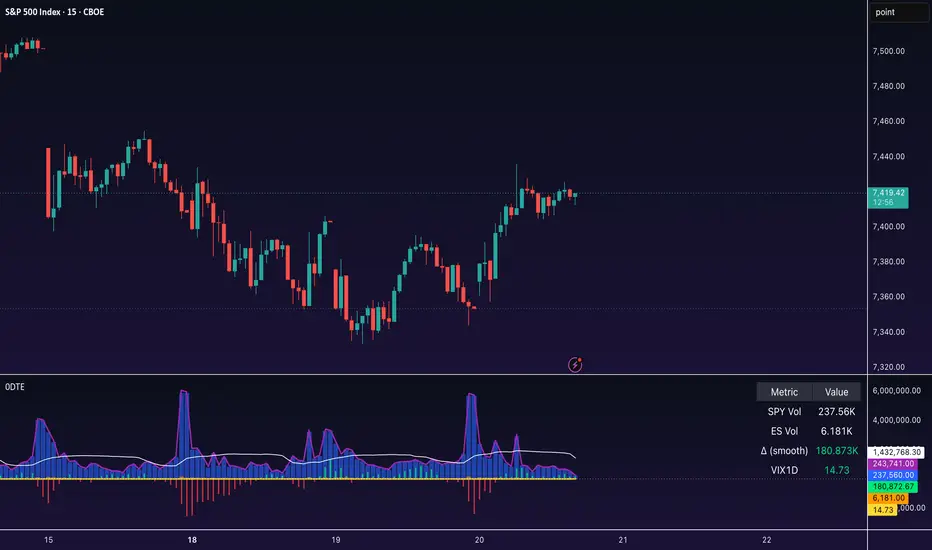
0DTE Tape Read: Combining SPY + ES Volume, VIX1D, and Volume Delta for Same-Day Options Trading
Why I Built This
If you trade 0DTE options on SPX or
  SPY SPY, you already know raw SPY volume alone gives you an incomplete picture. The real flow lives across multiple instruments:
This indicator combines all three into a single pane so you can read the tape the way it actually trades, not the way a single-symbol volume bar suggests.
What the Indicator Shows
A dashboard in the top-right shows live values for each metric.
Why This Beats Single-Symbol Volume
Three reasons SPY volume alone falls short for 0DTE:
VIX1D rounds it out because 0DTE pricing is driven by 1-day implied vol, not the headline VIX number on financial TV.
How to Trade With It
Setup
The Core Read
High-Probability Windows
Opening Drive (9:30 to 10:00)
A first-15-minute volume spike with delta in one direction signals a trend day. Enter on the first pullback to the combined volume MA. If VIX1D is above 18, widen your stop and cut your size.
Reversal Window (10:00 to 10:30)
Watch for delta to flip against the opening move on rising volume. This is statistically the best risk/reward window of the day. Reversal setups here have a real edge if the histogram confirms.
Fed/News Pivot (14:00)
On Fed days or scheduled releases, look for the volume surge plus clear delta direction and follow it. If VIX1D spikes and delta flips, fade the initial knee-jerk move.
MOC Ramp (15:00 to 16:00)
0DTE gamma is at its peak. Sustained delta in one direction tends to accelerate into the close. Exit by 15:45 unless you're actively scalping into the bell.
Strike Selection by VIX1D
Risk Rules
Quick Decision Tree
What This Indicator Is Not
It's not a signal generator. It's a confirmation and context tool. The edge comes from using it to say no to 80% of setups you would have taken on raw volume alone.
Combine it with your own price action read, key levels, and gamma exposure data for full context.
Known Limitations
Inputs You Can Customize
Final Thoughts
0DTE is a game of probabilities, timing, and discipline.
Most retail traders blow up because they trade size based on raw price action without understanding the flow underneath or the vol regime they're inside of.
This indicator forces you to look at all three at once:
Use it as a filter, not a crystal ball.
The best trades will scream at you when every layer aligns. Everything else is noise.
If you found this useful, hit boost, drop a comment with how you're using it, and follow for more tools focused on real-world execution.
Why I Built This
If you trade 0DTE options on
SPX or SPY SPY, you already know raw SPY volume alone gives you an incomplete picture. The real flow lives across multiple instruments:- SPY captures retail and ETF arbitrage
- ES futures lead price discovery and show institutional hedging
- VIX1D tells you the implied vol regime for the day you're actually trading
This indicator combines all three into a single pane so you can read the tape the way it actually trades, not the way a single-symbol volume bar suggests.
What the Indicator Shows
- SPY Volume (blue columns)
Retail flow, ETF arb, and dealer hedging on the cash side. - ES Volume (orange columns)
Institutional flow and the leading instrument for S&P price discovery. ES trades nearly 24 hours, so it shows you where the real money is positioned before the cash open and through the close. - Combined Volume Line (purple) with Moving Average
Total flow across both instruments. The MA gives you a baseline to spot real surges versus noise. - Volume Delta Histogram (green/red)
A signed-volume proxy using close vs open on each bar. Green means net buying pressure, red means net selling. Smoothed with an EMA to filter single-bar noise. - VIX1D Overlay (yellow)
The 1-day VIX. This is the single most important context metric for 0DTE that most traders ignore. It tells you what implied vol is pricing for today specifically, not the 30-day VIX which is mostly irrelevant for same-day expiry.
A dashboard in the top-right shows live values for each metric.
Why This Beats Single-Symbol Volume
Three reasons SPY volume alone falls short for 0DTE:
- SPX dominates institutional 0DTE flow. Big players use SPX for cash settlement and 60/40 tax treatment. ES futures are the closest free proxy for that flow.
- Overnight and pre-market context. ES tells you the setup before SPY even opens.
- Dealer hedging happens in futures. When 0DTE gamma forces hedging, it shows up in ES first.
VIX1D rounds it out because 0DTE pricing is driven by 1-day implied vol, not the headline VIX number on financial TV.
How to Trade With It
Setup
- Timeframe: 1m or 5m on SPY or ES
- Active hours: 9:30 to 10:30 and 14:00 to 16:00 ET
- Skip the lunch chop window from roughly 11:30 to 13:30
The Core Read
- Bullish alignment: Green delta histogram rising + combined volume above MA + VIX1D stable or falling. Trade calls or call spreads.
- Bearish alignment: Red delta histogram falling + combined volume above MA + VIX1D rising. Trade puts or put spreads.
- Stand down: Delta near zero + volume below MA. Theta will eat you. No trade.
High-Probability Windows
Opening Drive (9:30 to 10:00)
A first-15-minute volume spike with delta in one direction signals a trend day. Enter on the first pullback to the combined volume MA. If VIX1D is above 18, widen your stop and cut your size.
Reversal Window (10:00 to 10:30)
Watch for delta to flip against the opening move on rising volume. This is statistically the best risk/reward window of the day. Reversal setups here have a real edge if the histogram confirms.
Fed/News Pivot (14:00)
On Fed days or scheduled releases, look for the volume surge plus clear delta direction and follow it. If VIX1D spikes and delta flips, fade the initial knee-jerk move.
MOC Ramp (15:00 to 16:00)
0DTE gamma is at its peak. Sustained delta in one direction tends to accelerate into the close. Exit by 15:45 unless you're actively scalping into the bell.
Strike Selection by VIX1D
- VIX1D below 12: ATM or one strike OTM. Expect small moves, take quick profits.
- VIX1D 12 to 18: Two to three strikes OTM. Normal-range day.
- VIX1D above 20: Five-plus strikes OTM. Fat tails are likely, premiums are rich, sizing should drop.
Risk Rules
- Risk 1 to 2% of account per trade. 0DTE goes to zero faster than you can react.
- Stop out if delta flips against you or price breaks the combined volume MA.
- Target 50 to 100% on premium. Don't get greedy on same-day expiry.
- No new positions after 15:45.
- Three losers in a row, you're done for the day. Walk away.
Quick Decision Tree
- Is combined volume above its MA? If no, no trade.
- Is delta strong and aligned with price? If yes, trade with trend.
- Is delta flipping opposite to price on rising volume? If yes, reversal setup.
- Is delta flat? No trade.
What This Indicator Is Not
It's not a signal generator. It's a confirmation and context tool. The edge comes from using it to say no to 80% of setups you would have taken on raw volume alone.
Combine it with your own price action read, key levels, and gamma exposure data for full context.
Known Limitations
- The delta calculation uses close vs open as a sign proxy. True signed volume requires tick data Pine Script can't access. The proxy is directionally useful but not exact.
- ES1! is the continuous front-month contract. Roll dynamics can create small discontinuities on roll dates.
- VIX1D only goes back to mid-2023, so backtests on older data won't include it.
Inputs You Can Customize
- Symbols for SPY, ES, and VIX1D
(defaults to AMEX:SPY, CME_MINI:ES1!, CBOE:VIX1D) - Toggle each plot on/off
- Moving average length for combined volume
- Smoothing length for the volume delta histogram
Final Thoughts
0DTE is a game of probabilities, timing, and discipline.
Most retail traders blow up because they trade size based on raw price action without understanding the flow underneath or the vol regime they're inside of.
This indicator forces you to look at all three at once:
- Where the money is
- Which direction it's going
- How much movement the market is pricing in
Use it as a filter, not a crystal ball.
The best trades will scream at you when every layer aligns. Everything else is noise.
If you found this useful, hit boost, drop a comment with how you're using it, and follow for more tools focused on real-world execution.
オープンソーススクリプト
TradingViewの精神に則り、このスクリプトの作者はコードをオープンソースとして公開してくれました。トレーダーが内容を確認・検証できるようにという配慮です。作者に拍手を送りましょう!無料で利用できますが、コードの再公開はハウスルールに従う必要があります。

Eric Thies
免責事項
これらの情報および投稿は、TradingViewが提供または承認する金融、投資、取引、またはその他の種類の助言もしくは推奨であることを意図したものではなく、またこれらに該当するものでもありません。詳細は利用規約をご覧ください。
オープンソーススクリプト
TradingViewの精神に則り、このスクリプトの作者はコードをオープンソースとして公開してくれました。トレーダーが内容を確認・検証できるようにという配慮です。作者に拍手を送りましょう!無料で利用できますが、コードの再公開はハウスルールに従う必要があります。
Eric Thies
免責事項
これらの情報および投稿は、TradingViewが提供または承認する金融、投資、取引、またはその他の種類の助言もしくは推奨であることを意図したものではなく、またこれらに該当するものでもありません。詳細は利用規約をご覧ください。