SuperRSI: Enhanced Momentum
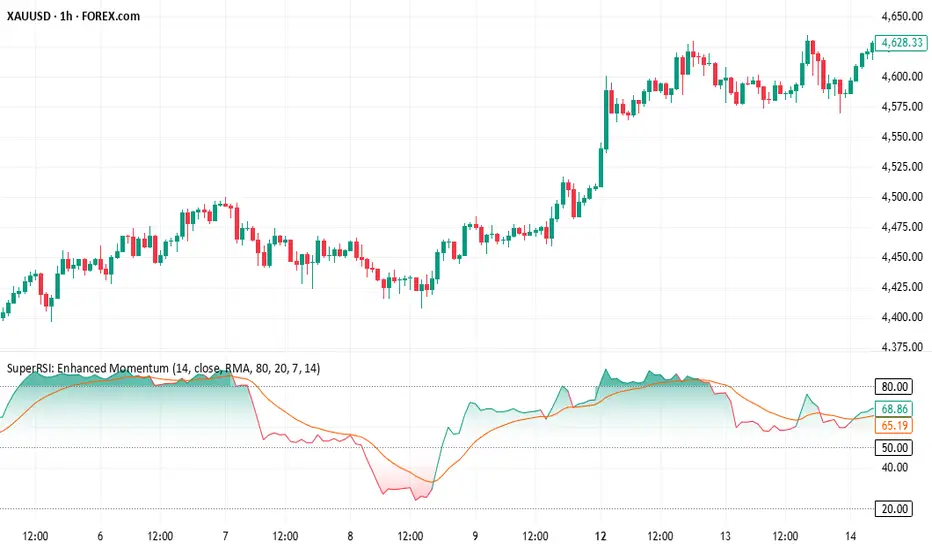
Title: SuperRSI: Enhanced Momentum
Description:
Overview The SuperRSI is not your standard Relative Strength Index. While traditional RSI calculates momentum based solely on close prices, this "Titan Edition" incorporates price structure breakouts. It analyzes whether the price is breaking new highs or lows within the lookback period to calculate momentum. This makes the SuperRSI significantly more responsive to volatility and genuine market action than the classic formula.
Key Features
Titan Calculation Logic: Uses High/Low breakouts to capture true momentum, making it faster and more sensitive than standard RSI.
Dynamic Trend Coloring: The RSI line automatically changes color to give you an instant visual bias:
Green: RSI is above the Signal Line (Bullish Momentum).
Red: RSI is below the Signal Line (Bearish Momentum).
Signal Line Filtering: Includes a built-in "Slow Signal" (EMA based) to help filter out market noise and identify sustainable trends.
Visual Gradients: Clear background fills for Overbought (OB) and Oversold (OS) zones to highlight extreme conditions.
How to Use
Trend Identification: Simply look at the line color. If it’s Green, momentum is bullish. If it’s Red, momentum is bearish.
Entry & Exit Signals: Watch for the crossover between the RSI line and the Signal Line. A cross above is a buy signal; a cross below is a sell signal.
Overbought/Oversold:
Above 80: Extreme bullish momentum (potential reversal or strong trend continuation).
Below 20: Extreme bearish momentum.
Settings
Fully customizable lengths for RSI and Signal lines.
Adjustable Smoothing methods (RMA, SMA, EMA).
Customizable Overbought/Oversold levels (Default: 80/20)
العنوان: SuperRSI: Enhanced Momentum
الوصف:
نظرة عامة مؤشر SuperRSI ليس مجرد مؤشر قوة نسبية تقليدي. بينما يعتمد الـ RSI العادي على أسعار الإغلاق فقط، تعتمد هذه النسخة المطور (Titan Edition) على اختراقات الهيكل السعري. يقوم المؤشر بحساب الزخم بناءً على ما إذا كان السعر يكسر قمماً جديدة أو قيعانًا جديدة خلال الفترة المحددة. هذا يجعله أكثر استجابة للتقلبات وحركة السوق الحقيقية مقارنة بالمعادلة الكلاسيكية.
أهم المميزات
معادلة Titan للزخم: تستخدم اختراقات القمم والقيعان (High/Low) لالتقاط الزخم الحقيقي، مما يجعله أسرع وأدق من RSI العادي.
تلوين ديناميكي للاتجاه: يتغير لون خط المؤشر تلقائياً ليعطيك رؤية فورية للاتجاه:
اللون الأخضر: الـ RSI يتداول فوق خط الإشارة (زخم صاعد).
اللون الأحمر: الـ RSI يتداول تحت خط الإشارة (زخم هابط).
فلترة الإشارات: يحتوي على "خط إشارة" مدمج (Slow Signal) لتنقية ضجيج السوق (Noise) وتحديد الاتجاهات المستدامة.
تدرجات لونية: خلفيات واضحة لمناطق التشبع الشرائي (Overbought) والتشبع البيعي (Oversold).
طريقة الاستخدام
تحديد الاتجاه: انظر ببساطة إلى لون الخط. إذا كان أخضر فالزخم شرائي، وإذا كان أحمر فالزخم بيعي.
إشارات الدخول والخروج: راقب التقاطع بين خط الـ RSI وخط الإشارة. التقاطع لأعلى يعتبر إشارة شراء، والتقاطع لأسفل يعتبر إشارة بيع.
مناطق التشبع:
فوق 80: تشبع شرائي (احتمالية انعكاس أو استمرار قوي للترند).
تحت 20: تشبع بيعي.
الإعدادات
إمكانية تعديل المدة الزمنية (Length) للـ RSI وخطوط الإشارة.
خيارات متعددة لنوع المتوسط المستخدم (RMA, SMA, EMA).
مستويات تشبع قابلة للتعديل (الافتراضي: 80/20).
Description:
Overview The SuperRSI is not your standard Relative Strength Index. While traditional RSI calculates momentum based solely on close prices, this "Titan Edition" incorporates price structure breakouts. It analyzes whether the price is breaking new highs or lows within the lookback period to calculate momentum. This makes the SuperRSI significantly more responsive to volatility and genuine market action than the classic formula.
Key Features
Titan Calculation Logic: Uses High/Low breakouts to capture true momentum, making it faster and more sensitive than standard RSI.
Dynamic Trend Coloring: The RSI line automatically changes color to give you an instant visual bias:
Green: RSI is above the Signal Line (Bullish Momentum).
Red: RSI is below the Signal Line (Bearish Momentum).
Signal Line Filtering: Includes a built-in "Slow Signal" (EMA based) to help filter out market noise and identify sustainable trends.
Visual Gradients: Clear background fills for Overbought (OB) and Oversold (OS) zones to highlight extreme conditions.
How to Use
Trend Identification: Simply look at the line color. If it’s Green, momentum is bullish. If it’s Red, momentum is bearish.
Entry & Exit Signals: Watch for the crossover between the RSI line and the Signal Line. A cross above is a buy signal; a cross below is a sell signal.
Overbought/Oversold:
Above 80: Extreme bullish momentum (potential reversal or strong trend continuation).
Below 20: Extreme bearish momentum.
Settings
Fully customizable lengths for RSI and Signal lines.
Adjustable Smoothing methods (RMA, SMA, EMA).
Customizable Overbought/Oversold levels (Default: 80/20)
العنوان: SuperRSI: Enhanced Momentum
الوصف:
نظرة عامة مؤشر SuperRSI ليس مجرد مؤشر قوة نسبية تقليدي. بينما يعتمد الـ RSI العادي على أسعار الإغلاق فقط، تعتمد هذه النسخة المطور (Titan Edition) على اختراقات الهيكل السعري. يقوم المؤشر بحساب الزخم بناءً على ما إذا كان السعر يكسر قمماً جديدة أو قيعانًا جديدة خلال الفترة المحددة. هذا يجعله أكثر استجابة للتقلبات وحركة السوق الحقيقية مقارنة بالمعادلة الكلاسيكية.
أهم المميزات
معادلة Titan للزخم: تستخدم اختراقات القمم والقيعان (High/Low) لالتقاط الزخم الحقيقي، مما يجعله أسرع وأدق من RSI العادي.
تلوين ديناميكي للاتجاه: يتغير لون خط المؤشر تلقائياً ليعطيك رؤية فورية للاتجاه:
اللون الأخضر: الـ RSI يتداول فوق خط الإشارة (زخم صاعد).
اللون الأحمر: الـ RSI يتداول تحت خط الإشارة (زخم هابط).
فلترة الإشارات: يحتوي على "خط إشارة" مدمج (Slow Signal) لتنقية ضجيج السوق (Noise) وتحديد الاتجاهات المستدامة.
تدرجات لونية: خلفيات واضحة لمناطق التشبع الشرائي (Overbought) والتشبع البيعي (Oversold).
طريقة الاستخدام
تحديد الاتجاه: انظر ببساطة إلى لون الخط. إذا كان أخضر فالزخم شرائي، وإذا كان أحمر فالزخم بيعي.
إشارات الدخول والخروج: راقب التقاطع بين خط الـ RSI وخط الإشارة. التقاطع لأعلى يعتبر إشارة شراء، والتقاطع لأسفل يعتبر إشارة بيع.
مناطق التشبع:
فوق 80: تشبع شرائي (احتمالية انعكاس أو استمرار قوي للترند).
تحت 20: تشبع بيعي.
الإعدادات
إمكانية تعديل المدة الزمنية (Length) للـ RSI وخطوط الإشارة.
خيارات متعددة لنوع المتوسط المستخدم (RMA, SMA, EMA).
مستويات تشبع قابلة للتعديل (الافتراضي: 80/20).

免責事項
これらの情報および投稿は、TradingViewが提供または承認する金融、投資、取引、またはその他の種類の助言もしくは推奨であることを意図したものではなく、またこれらに該当するものでもありません。詳細は利用規約をご覧ください。
免責事項
これらの情報および投稿は、TradingViewが提供または承認する金融、投資、取引、またはその他の種類の助言もしくは推奨であることを意図したものではなく、またこれらに該当するものでもありません。詳細は利用規約をご覧ください。