アップデート済
Solar & Lunar Eclipse Cycles [WenMoonLambo]
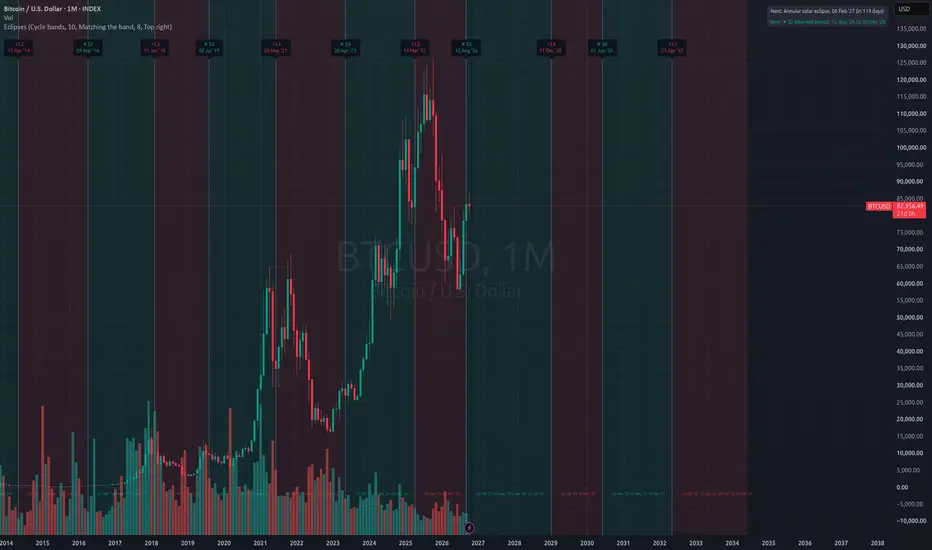
This indicator puts every solar and lunar eclipse from 2009 to 2040 on any chart, in two views.
Cycle bands (default)
• Shades the chart in alternating solar-led (green) and lunar-led (red) periods of roughly 18 months, 14 periods from 2009 to 2034, each starting on an eclipse.
• Labels each period at its start (for example ☀ S5, 12 Aug '26) and draws a grey boundary line.
• Marks the eclipses inside each period with dashed lines and small dates along the bottom. Choose which: those matching the period's type, totals only, all, or none.
• Shades upcoming periods past today, and a panel shows the current period and the next eclipse.
• The colours only show which eclipse type leads a period. They are not buy or sell signals.
All eclipses
• A line at the moment of greatest eclipse (solid for total eclipses, dotted for the rest) and a label on the bar, with the exact time in the tooltip.
• Each eclipse type can be switched on and off; upcoming eclipses are drawn ahead of the last bar.
• An alert condition fires on the bar containing an eclipse.
Data
All 146 eclipse dates and types come from NASA's Five Millennium Canon of eclipses (Espenak and Meeus, NASA Goddard Space Flight Center). Times are the instant of greatest eclipse in Terrestrial Time, about 69 seconds ahead of UTC, so the date is never affected. Borderline penumbral events that the canon doesn't count, such as 18 August 2016, are left out.
A note on use
This is a calendar tool. Eclipses are precisely predictable astronomical events; whether they relate to market moves is a separate question, and tests of lunar-cycle effects on Bitcoin have not found a reliable edge. Use it to check claims against the chart yourself, not as a signal.
Cycle bands (default)
• Shades the chart in alternating solar-led (green) and lunar-led (red) periods of roughly 18 months, 14 periods from 2009 to 2034, each starting on an eclipse.
• Labels each period at its start (for example ☀ S5, 12 Aug '26) and draws a grey boundary line.
• Marks the eclipses inside each period with dashed lines and small dates along the bottom. Choose which: those matching the period's type, totals only, all, or none.
• Shades upcoming periods past today, and a panel shows the current period and the next eclipse.
• The colours only show which eclipse type leads a period. They are not buy or sell signals.
All eclipses
• A line at the moment of greatest eclipse (solid for total eclipses, dotted for the rest) and a label on the bar, with the exact time in the tooltip.
• Each eclipse type can be switched on and off; upcoming eclipses are drawn ahead of the last bar.
• An alert condition fires on the bar containing an eclipse.
Data
All 146 eclipse dates and types come from NASA's Five Millennium Canon of eclipses (Espenak and Meeus, NASA Goddard Space Flight Center). Times are the instant of greatest eclipse in Terrestrial Time, about 69 seconds ahead of UTC, so the date is never affected. Borderline penumbral events that the canon doesn't count, such as 18 August 2016, are left out.
A note on use
This is a calendar tool. Eclipses are precisely predictable astronomical events; whether they relate to market moves is a separate question, and tests of lunar-cycle effects on Bitcoin have not found a reliable edge. Use it to check claims against the chart yourself, not as a signal.
リリースノート
• New setting: choose which corner the countdown panel sits in (Display → Countdown panel).• Chart image updated to show Bitcoin's eclipse periods from 2014 and the upcoming periods through 2033.
No changes to the eclipse data or the period calculations.

免責事項
これらの情報および投稿は、TradingViewが提供または承認する金融、投資、取引、またはその他の種類の助言もしくは推奨であることを意図したものではなく、またこれらに該当するものでもありません。詳細は利用規約をご覧ください。
免責事項
これらの情報および投稿は、TradingViewが提供または承認する金融、投資、取引、またはその他の種類の助言もしくは推奨であることを意図したものではなく、またこれらに該当するものでもありません。詳細は利用規約をご覧ください。