OPEN-SOURCE SCRIPT
Fiery River V.2.0 with Volatility
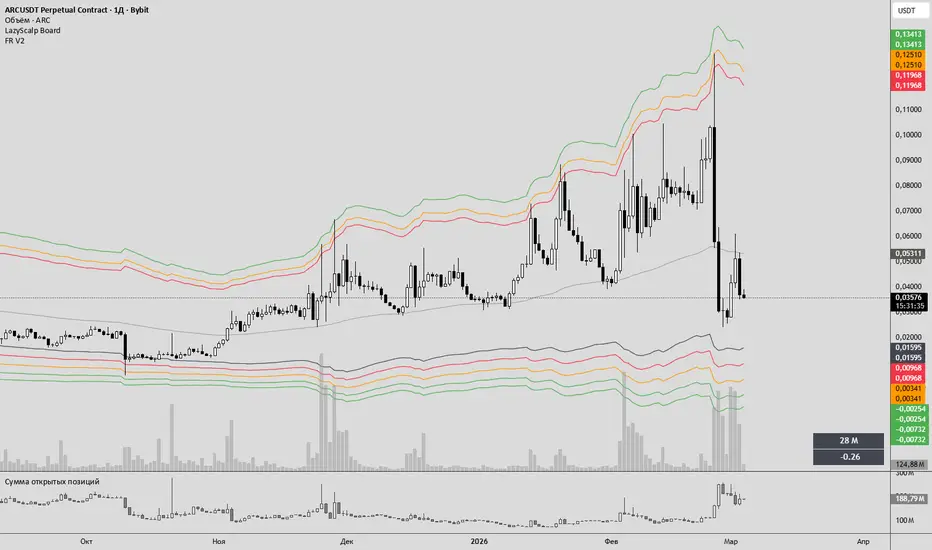
What does the indicator do?
The indicator combines the selected moving average with Fibonacci levels, which are adjusted depending on market volatility (ATR). It helps traders quickly see potential support and resistance zones, as well as take into account changes in market dynamics.
Basic elements
The main MA is selected from several types (EMA, SMA, WMA, RMA, HMA) and calculated over a specified period. The line is usually gray.
Fibonacci Levels (long) – calculated as The MA * coefficient is ATR. These are lower levels that are considered potential support areas.
Fibonacci Levels (short) – calculated as MA * coefficient + ATR * 2. These are higher levels that are considered potential resistance zones.
The second MA is a similar MA, but based on a different timeframe selected by the user (for example, daily). The line is a different color (usually red).
The levels of the second MA are long and short levels calculated according to the same logic, but for the second MA.
How the indicator works
ATR is calculated based on the selected period, reflecting the current volatility.
MA – calculated according to the selected type and period.
The second MA gets the same values, but on a different timeframe.
Fibonacci Levels
Long levels: MA * coefficient - ATR.
Short levels: MA * coefficient + ATR *
2.5. Readings on the graph – the level lines are displayed in different colors and with different transparency to make them easy to distinguish.
How to use the indicator
Setup – in the "Indicator Settings" section, select the type and period of the MA, the ATR period, the Fibonacci coefficients and the timeframe for the second MA.
Analysis – keep an eye on the price crossing the Fibonacci levels. Long levels can serve as support zones, short levels can serve as resistance zones.
Alerts – Set up alerts (alertcondition) for price intersections with levels to receive instant notifications of potential signals.
Combining – use the indicator in combination with other instruments (volume, RSI, MACD) to confirm the signals and improve your trading strategy.
Practical advice
ATR adaptation makes the levels more flexible during periods of high volatility, reducing the likelihood of false signals.
The second MA allows you to see long-term trends and synchronize signals with a wider horizon.
Fibonacci coefficients can be changed depending on a particular market or period to better match its nature.
Alerts help you avoid missing important intersections, especially if you can't keep track of the graph all the time.
The Fiery River V.2.0 indicator with Volatility is a flexible tool that combines moving averages, Fibonacci levels and volatility adaptation, allowing traders to make more informed decisions on different timeframes
The indicator combines the selected moving average with Fibonacci levels, which are adjusted depending on market volatility (ATR). It helps traders quickly see potential support and resistance zones, as well as take into account changes in market dynamics.
Basic elements
The main MA is selected from several types (EMA, SMA, WMA, RMA, HMA) and calculated over a specified period. The line is usually gray.
Fibonacci Levels (long) – calculated as The MA * coefficient is ATR. These are lower levels that are considered potential support areas.
Fibonacci Levels (short) – calculated as MA * coefficient + ATR * 2. These are higher levels that are considered potential resistance zones.
The second MA is a similar MA, but based on a different timeframe selected by the user (for example, daily). The line is a different color (usually red).
The levels of the second MA are long and short levels calculated according to the same logic, but for the second MA.
How the indicator works
ATR is calculated based on the selected period, reflecting the current volatility.
MA – calculated according to the selected type and period.
The second MA gets the same values, but on a different timeframe.
Fibonacci Levels
Long levels: MA * coefficient - ATR.
Short levels: MA * coefficient + ATR *
2.5. Readings on the graph – the level lines are displayed in different colors and with different transparency to make them easy to distinguish.
How to use the indicator
Setup – in the "Indicator Settings" section, select the type and period of the MA, the ATR period, the Fibonacci coefficients and the timeframe for the second MA.
Analysis – keep an eye on the price crossing the Fibonacci levels. Long levels can serve as support zones, short levels can serve as resistance zones.
Alerts – Set up alerts (alertcondition) for price intersections with levels to receive instant notifications of potential signals.
Combining – use the indicator in combination with other instruments (volume, RSI, MACD) to confirm the signals and improve your trading strategy.
Practical advice
ATR adaptation makes the levels more flexible during periods of high volatility, reducing the likelihood of false signals.
The second MA allows you to see long-term trends and synchronize signals with a wider horizon.
Fibonacci coefficients can be changed depending on a particular market or period to better match its nature.
Alerts help you avoid missing important intersections, especially if you can't keep track of the graph all the time.
The Fiery River V.2.0 indicator with Volatility is a flexible tool that combines moving averages, Fibonacci levels and volatility adaptation, allowing traders to make more informed decisions on different timeframes
オープンソーススクリプト
TradingViewの精神に則り、このスクリプトの作者はコードをオープンソースとして公開してくれました。トレーダーが内容を確認・検証できるようにという配慮です。作者に拍手を送りましょう!無料で利用できますが、コードの再公開はハウスルールに従う必要があります。

免責事項
これらの情報および投稿は、TradingViewが提供または承認する金融、投資、取引、またはその他の種類の助言もしくは推奨であることを意図したものではなく、またこれらに該当するものでもありません。詳細は利用規約をご覧ください。
オープンソーススクリプト
TradingViewの精神に則り、このスクリプトの作者はコードをオープンソースとして公開してくれました。トレーダーが内容を確認・検証できるようにという配慮です。作者に拍手を送りましょう!無料で利用できますが、コードの再公開はハウスルールに従う必要があります。
免責事項
これらの情報および投稿は、TradingViewが提供または承認する金融、投資、取引、またはその他の種類の助言もしくは推奨であることを意図したものではなく、またこれらに該当するものでもありません。詳細は利用規約をご覧ください。