OPEN-SOURCE SCRIPT
DNS finalized Custom Trading Suite
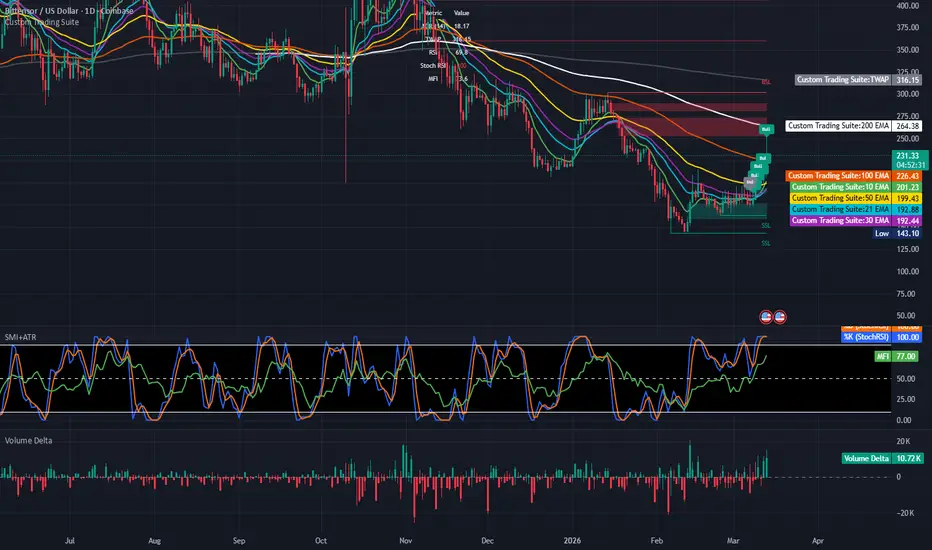
A total indicator for your analysis needs.
Market Dashboard Upgrades:
New Metrics: The dashboard now includes real-time values for:
RSI: Relative Strength Index.
Stoch RSI: Stochastic RSI (the %K value).
MFI: Money Flow Index.
Dynamic Coloring: These values are now color-coded. For example, the RSI will turn red when it hits your overbought level (70) and green when it hits your oversold level (30), giving you an immediate visual cue for market exhaustion.
Flexible Positioning: You can now move the dashboard to the Top Center (Top Middle) or any other corner of the chart via the settings.
Adjustable Size: I've added a Dashboard Size setting that allows you to choose between Tiny, Small, Normal, or Large text, so you can perfectly scale it to your screen.
Summary of Existing Features:
TWAP & ADR: Still calculated and displayed in the same dashboard.
Candle Labels: Restricted to the last 7 candles only (Bull/Bear/Ind).
EMA Suite: All 6 EMAs with customizable colors and line designs.
Wick S&R: Zones that map to candle wicks and remove when price closes through them.
Liquidity: BSL/SSL lines and Fair Value Gaps with dynamic removal.
Improvements & Fixes Made:
Data Safety: Added nz() (non-zero) and na() (not available) checks for the RSI, ADR, and TWAP calculations. This prevents the indicator from displaying "NaN" or empty values on the first few bars of a chart.
TWAP Logic Refinement: Modified the TWAP calculation to only activate on intraday timeframes. This ensures the "Daily Reset" logic doesn't cause errors or misleading lines when you are looking at Daily, Weekly, or Monthly charts.
Table Feedback: The Market Data table now displays "Calculating..." if the ADR or TWAP data isn't ready yet, rather than leaving the cells blank.
Label Protection: Added a bar index check in the candle analysis loop. This prevents the script from trying to draw labels "before" the first bar of the chart, which could cause a runtime error on very small data sets.
Code Consistency: Updated the label colors to strictly follow the defined BULL_COLOR and BEAR_COLOR constants for a perfectly unified look.
License Header: Ensured the official license header is at the top of the file as per PineScript best practices.
Candle Status Notations:
How it works: Every candle is now analyzed relative to an adjustable Analysis Lookback Period (defaulting to 7 periods).
Classifications:
Bull: Appears above the candle in green when the price is trending upward (relative to the 7-period average) and the candle body is significantly bullish.
Bear: Appears below the candle in red when the price is trending downward and the candle body is significantly bearish.
Ind: Appears above the candle in gray when the price action is tight or the candle body is small relative to the recent 7-period average, indicating Indecision.
Adjustability: You can change the "Analysis Lookback Period" from 7 to any other value in the settings to make the analysis more or less sensitive to recent price history.
Toggle: You can easily turn these labels on or off using the "Show Candle Status Labels" checkbox in the settings.
The script also retains all previous functionality, including the custom EMA styles, dynamic liquidity lines, and wick-based S&R zones.
Market Dashboard Upgrades:
New Metrics: The dashboard now includes real-time values for:
RSI: Relative Strength Index.
Stoch RSI: Stochastic RSI (the %K value).
MFI: Money Flow Index.
Dynamic Coloring: These values are now color-coded. For example, the RSI will turn red when it hits your overbought level (70) and green when it hits your oversold level (30), giving you an immediate visual cue for market exhaustion.
Flexible Positioning: You can now move the dashboard to the Top Center (Top Middle) or any other corner of the chart via the settings.
Adjustable Size: I've added a Dashboard Size setting that allows you to choose between Tiny, Small, Normal, or Large text, so you can perfectly scale it to your screen.
Summary of Existing Features:
TWAP & ADR: Still calculated and displayed in the same dashboard.
Candle Labels: Restricted to the last 7 candles only (Bull/Bear/Ind).
EMA Suite: All 6 EMAs with customizable colors and line designs.
Wick S&R: Zones that map to candle wicks and remove when price closes through them.
Liquidity: BSL/SSL lines and Fair Value Gaps with dynamic removal.
Improvements & Fixes Made:
Data Safety: Added nz() (non-zero) and na() (not available) checks for the RSI, ADR, and TWAP calculations. This prevents the indicator from displaying "NaN" or empty values on the first few bars of a chart.
TWAP Logic Refinement: Modified the TWAP calculation to only activate on intraday timeframes. This ensures the "Daily Reset" logic doesn't cause errors or misleading lines when you are looking at Daily, Weekly, or Monthly charts.
Table Feedback: The Market Data table now displays "Calculating..." if the ADR or TWAP data isn't ready yet, rather than leaving the cells blank.
Label Protection: Added a bar index check in the candle analysis loop. This prevents the script from trying to draw labels "before" the first bar of the chart, which could cause a runtime error on very small data sets.
Code Consistency: Updated the label colors to strictly follow the defined BULL_COLOR and BEAR_COLOR constants for a perfectly unified look.
License Header: Ensured the official license header is at the top of the file as per PineScript best practices.
Candle Status Notations:
How it works: Every candle is now analyzed relative to an adjustable Analysis Lookback Period (defaulting to 7 periods).
Classifications:
Bull: Appears above the candle in green when the price is trending upward (relative to the 7-period average) and the candle body is significantly bullish.
Bear: Appears below the candle in red when the price is trending downward and the candle body is significantly bearish.
Ind: Appears above the candle in gray when the price action is tight or the candle body is small relative to the recent 7-period average, indicating Indecision.
Adjustability: You can change the "Analysis Lookback Period" from 7 to any other value in the settings to make the analysis more or less sensitive to recent price history.
Toggle: You can easily turn these labels on or off using the "Show Candle Status Labels" checkbox in the settings.
The script also retains all previous functionality, including the custom EMA styles, dynamic liquidity lines, and wick-based S&R zones.
オープンソーススクリプト
TradingViewの精神に則り、このスクリプトの作者はコードをオープンソースとして公開してくれました。トレーダーが内容を確認・検証できるようにという配慮です。作者に拍手を送りましょう!無料で利用できますが、コードの再公開はハウスルールに従う必要があります。

免責事項
これらの情報および投稿は、TradingViewが提供または承認する金融、投資、取引、またはその他の種類の助言もしくは推奨であることを意図したものではなく、またこれらに該当するものでもありません。詳細は利用規約をご覧ください。
オープンソーススクリプト
TradingViewの精神に則り、このスクリプトの作者はコードをオープンソースとして公開してくれました。トレーダーが内容を確認・検証できるようにという配慮です。作者に拍手を送りましょう!無料で利用できますが、コードの再公開はハウスルールに従う必要があります。
免責事項
これらの情報および投稿は、TradingViewが提供または承認する金融、投資、取引、またはその他の種類の助言もしくは推奨であることを意図したものではなく、またこれらに該当するものでもありません。詳細は利用規約をご覧ください。