Short-Term Horizon Probability (Real-Time Buy/Sell Edge)
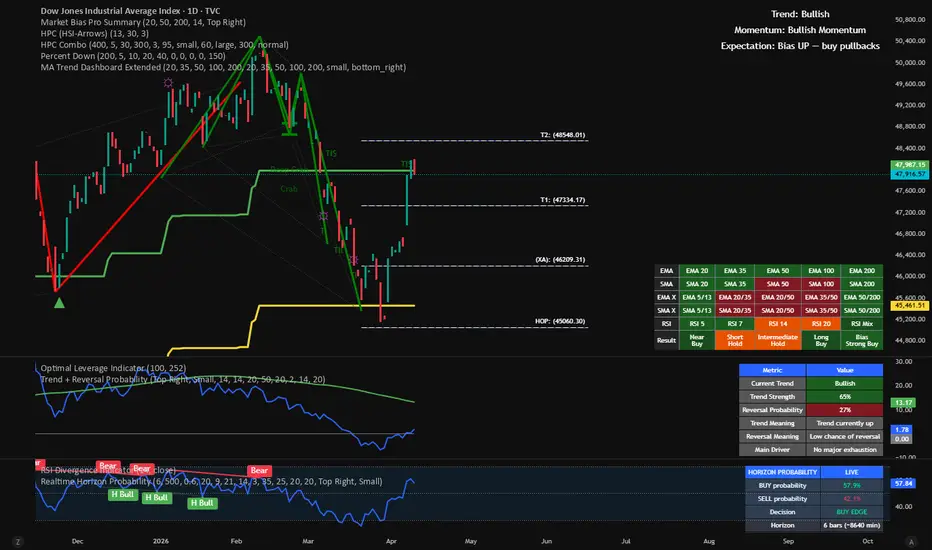
This indicator provides a real-time probabilistic edge for short-term trading based on a defined time horizon.
It answers a simple and practical question:
“If I enter a trade now, what is the probability that price will be higher or lower after a specific number of bars?”
How it works
The model combines multiple short-term signals:
Fast vs. slow EMA (trend)
Price relative to VWAP (institutional positioning)
RSI (momentum)
Short-term price momentum
It then compares the current market state to similar historical conditions and evaluates what happened after a user-defined horizon.
Key Outputs
BUY probability
Probability that price will be higher after the selected horizon
SELL probability
Probability that price will be lower after the selected horizon
Decision
BUY EDGE → bullish advantage
SELL EDGE → bearish advantage
NO EDGE → no statistical advantage
Horizon
Defined in bars and automatically translated into minutes based on the chart timeframe
How to use
Choose your timeframe (1m, 3m, 5m, etc.)
Set the Horizon (bars) according to your holding period
Example:
5-minute chart + 6 bars = ~30 minutes
1-minute chart + 30 bars = ~30 minutes
Trade based on probabilities:
BUY > 55% → bullish edge
SELL > 55% → bearish edge
Otherwise → no trade
Important Notes
Probabilities are dynamic and update in real time
BUY and SELL probabilities always sum to 100%
A fallback model ensures continuous output even when historical matches are limited
Designed specifically for short-term trading and intraday decision-making
Best Use Cases
Scalping and intraday trading
Timing entries with a statistical edge
Filtering low-quality setups (NO EDGE zones)
It answers a simple and practical question:
“If I enter a trade now, what is the probability that price will be higher or lower after a specific number of bars?”
How it works
The model combines multiple short-term signals:
Fast vs. slow EMA (trend)
Price relative to VWAP (institutional positioning)
RSI (momentum)
Short-term price momentum
It then compares the current market state to similar historical conditions and evaluates what happened after a user-defined horizon.
Key Outputs
BUY probability
Probability that price will be higher after the selected horizon
SELL probability
Probability that price will be lower after the selected horizon
Decision
BUY EDGE → bullish advantage
SELL EDGE → bearish advantage
NO EDGE → no statistical advantage
Horizon
Defined in bars and automatically translated into minutes based on the chart timeframe
How to use
Choose your timeframe (1m, 3m, 5m, etc.)
Set the Horizon (bars) according to your holding period
Example:
5-minute chart + 6 bars = ~30 minutes
1-minute chart + 30 bars = ~30 minutes
Trade based on probabilities:
BUY > 55% → bullish edge
SELL > 55% → bearish edge
Otherwise → no trade
Important Notes
Probabilities are dynamic and update in real time
BUY and SELL probabilities always sum to 100%
A fallback model ensures continuous output even when historical matches are limited
Designed specifically for short-term trading and intraday decision-making
Best Use Cases
Scalping and intraday trading
Timing entries with a statistical edge
Filtering low-quality setups (NO EDGE zones)

免責事項
これらの情報および投稿は、TradingViewが提供または承認する金融、投資、取引、またはその他の種類の助言もしくは推奨であることを意図したものではなく、またこれらに該当するものでもありません。詳細は利用規約をご覧ください。
免責事項
これらの情報および投稿は、TradingViewが提供または承認する金融、投資、取引、またはその他の種類の助言もしくは推奨であることを意図したものではなく、またこれらに該当するものでもありません。詳細は利用規約をご覧ください。