Volatility Supply and Demand Zones
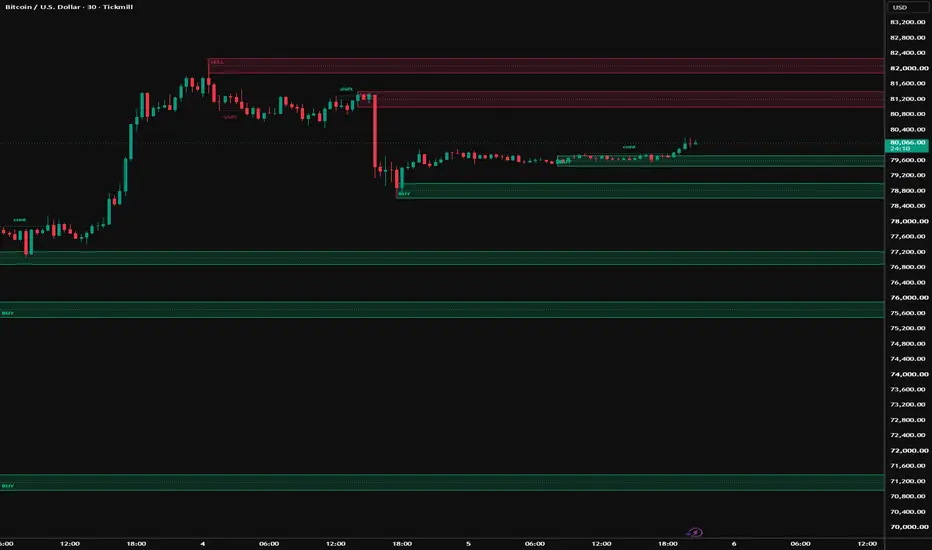
Most supply and demand tools have the same two problems. They stack near-identical zones on top of each other until the chart is unreadable, and they leave dead zones projecting to the right edge forever, long after price has traded straight through them. This script is built to fix both.
Everything here is measured in ATR, so the same settings behave proportionately on a quiet instrument and a violent one.
HOW A ZONE IS BUILT
A confirmed pivot marks the edge of a zone. Its depth is a fraction of ATR(50):
buffer = ATR(50) * zone depth / 10
A sell zone takes the pivot high as its top and extends the buffer downwards. A buy zone takes the pivot low as its bottom and extends the buffer upwards. A dotted mid line marks the centre of each zone.
Zone depth 2.5 therefore spans a quarter of one ATR. The zone is anchored to the bar the pivot actually formed on, not the bar that confirmed it.
WHY ZONES DO NOT PILE UP
This is the part that changes how the chart reads.
Before a zone is drawn, its midpoint is measured against the midpoint of every live zone on the same side. If it falls inside a separation band of a chosen ATR multiple, it is refused and nothing is drawn.
The effect is most obvious during consolidation, which is exactly where an unfiltered supply and demand indicator produces a dozen overlapping bands that all mean the same thing.
One detail matters here: a zone that has already been broken is removed from the live set, so it can never block a fresh zone that forms in the same price area later. Zones filter each other only while they are still alive.
WHAT HAPPENS WHEN A ZONE IS BROKEN
A sell zone is broken by a close above its top, a buy zone by a close below its bottom. There is a switch for wick-based breaks, which retires zones far more aggressively.
Three behaviours are available:
- Remove deletes the zone outright. Cleanest chart.
- Freeze at the break stops it extending, so it stays as history at the bar it died.
- Leave it running keeps it projecting forever, for anyone who wants the old behaviour.
Frozen zones are capped by the same memory setting, so they cannot accumulate without limit.
MARKET STRUCTURE
A second, stricter detector runs alongside the zones.
A swing is only accepted when price staircased into it and staircased back out of it. Every bar approaching the swing must be higher than the one before, and every bar leaving it lower, with the swing bar itself the extreme of its own window. This is deliberately narrower than a plain pivot and it produces fewer, cleaner levels.
Strict staircase can be turned off. In tolerant mode an equal high or low no longer rejects a swing; only a bar moving the wrong way does. On instruments that print repeated highs this finds noticeably more structure, and the difference is worth measuring on your own symbol.
When a close takes a swing level out, the level is spent and cannot fire again. The break is classified against the standing phase:
- shift, when the break reverses the phase, or when it is the first break on the chart and there is no phase to continue
- cont, when the break extends the phase already in force
The tag sits midway along the line back to the level it took out, so it reads as a label for the whole move rather than an annotation on one bar.
SUPPORT AND RESISTANCE RAYS
Optional and off by default. After a structure break, a backward scan finds the extreme reached between the swing and the break, then projects it forward until a close takes it out.
It is off by default because it runs a scan on every break. The scan limit is adjustable and bounds the work done on a single bar.
SETTINGS THAT MATTER MOST
- Pivot length decides how much structure becomes a zone. Shorter reacts faster and draws more.
- Zone depth sets thickness only. It does not change where zones appear.
- Separation is the single most effective control over chart density.
- Structure span controls the swing detector independently of the zones.
NOTES FOR ANYONE READING THE CODE
Two things in here are easy to get wrong, and both are commented in the source.
ta.highest and ta.lowest carry rolling state and must be evaluated on every bar. Placed behind an and operator they get short-circuited away whenever an earlier condition fails, their window is then built from a sparse history, and the comparison silently stops matching. They are hoisted to the global scope for that reason.
The retirement pass walks its array backwards. Removing entries during a forward pass makes the loop skip the element that slides into the vacated index. Counted loops are also guarded against an empty array, because a Pine for loop from 0 to size minus one counts downwards when the array is empty and reads index minus one.
LIMITATIONS
- A pivot is only confirmed a number of bars after it forms. That delay is inherent to pivot detection and no indicator can remove it, here or anywhere else.
- Zone edges are drawn where the pivot was, so a zone appears on the chart later than the bar it is anchored to.
- In a tight range the separation filter will refuse most new zones by design. That is the intent, but it does mean the chart can look sparse exactly when price is busiest.
- The structure detector is strict by default and will miss swings on instruments that print equal highs and lows. Turn strict staircase off if that matters on your symbol.
- Nothing here predicts direction. It marks where price previously turned and whether those levels are still intact.
- Nothing here is financial advice. Position sizing and risk management remain your own responsibility.
This is original work. It reuses no code from any other publication. The source is open, so read it, change it, and take it further.
Everything here is measured in ATR, so the same settings behave proportionately on a quiet instrument and a violent one.
HOW A ZONE IS BUILT
A confirmed pivot marks the edge of a zone. Its depth is a fraction of ATR(50):
buffer = ATR(50) * zone depth / 10
A sell zone takes the pivot high as its top and extends the buffer downwards. A buy zone takes the pivot low as its bottom and extends the buffer upwards. A dotted mid line marks the centre of each zone.
Zone depth 2.5 therefore spans a quarter of one ATR. The zone is anchored to the bar the pivot actually formed on, not the bar that confirmed it.
WHY ZONES DO NOT PILE UP
This is the part that changes how the chart reads.
Before a zone is drawn, its midpoint is measured against the midpoint of every live zone on the same side. If it falls inside a separation band of a chosen ATR multiple, it is refused and nothing is drawn.
The effect is most obvious during consolidation, which is exactly where an unfiltered supply and demand indicator produces a dozen overlapping bands that all mean the same thing.
One detail matters here: a zone that has already been broken is removed from the live set, so it can never block a fresh zone that forms in the same price area later. Zones filter each other only while they are still alive.
WHAT HAPPENS WHEN A ZONE IS BROKEN
A sell zone is broken by a close above its top, a buy zone by a close below its bottom. There is a switch for wick-based breaks, which retires zones far more aggressively.
Three behaviours are available:
- Remove deletes the zone outright. Cleanest chart.
- Freeze at the break stops it extending, so it stays as history at the bar it died.
- Leave it running keeps it projecting forever, for anyone who wants the old behaviour.
Frozen zones are capped by the same memory setting, so they cannot accumulate without limit.
MARKET STRUCTURE
A second, stricter detector runs alongside the zones.
A swing is only accepted when price staircased into it and staircased back out of it. Every bar approaching the swing must be higher than the one before, and every bar leaving it lower, with the swing bar itself the extreme of its own window. This is deliberately narrower than a plain pivot and it produces fewer, cleaner levels.
Strict staircase can be turned off. In tolerant mode an equal high or low no longer rejects a swing; only a bar moving the wrong way does. On instruments that print repeated highs this finds noticeably more structure, and the difference is worth measuring on your own symbol.
When a close takes a swing level out, the level is spent and cannot fire again. The break is classified against the standing phase:
- shift, when the break reverses the phase, or when it is the first break on the chart and there is no phase to continue
- cont, when the break extends the phase already in force
The tag sits midway along the line back to the level it took out, so it reads as a label for the whole move rather than an annotation on one bar.
SUPPORT AND RESISTANCE RAYS
Optional and off by default. After a structure break, a backward scan finds the extreme reached between the swing and the break, then projects it forward until a close takes it out.
It is off by default because it runs a scan on every break. The scan limit is adjustable and bounds the work done on a single bar.
SETTINGS THAT MATTER MOST
- Pivot length decides how much structure becomes a zone. Shorter reacts faster and draws more.
- Zone depth sets thickness only. It does not change where zones appear.
- Separation is the single most effective control over chart density.
- Structure span controls the swing detector independently of the zones.
NOTES FOR ANYONE READING THE CODE
Two things in here are easy to get wrong, and both are commented in the source.
ta.highest and ta.lowest carry rolling state and must be evaluated on every bar. Placed behind an and operator they get short-circuited away whenever an earlier condition fails, their window is then built from a sparse history, and the comparison silently stops matching. They are hoisted to the global scope for that reason.
The retirement pass walks its array backwards. Removing entries during a forward pass makes the loop skip the element that slides into the vacated index. Counted loops are also guarded against an empty array, because a Pine for loop from 0 to size minus one counts downwards when the array is empty and reads index minus one.
LIMITATIONS
- A pivot is only confirmed a number of bars after it forms. That delay is inherent to pivot detection and no indicator can remove it, here or anywhere else.
- Zone edges are drawn where the pivot was, so a zone appears on the chart later than the bar it is anchored to.
- In a tight range the separation filter will refuse most new zones by design. That is the intent, but it does mean the chart can look sparse exactly when price is busiest.
- The structure detector is strict by default and will miss swings on instruments that print equal highs and lows. Turn strict staircase off if that matters on your symbol.
- Nothing here predicts direction. It marks where price previously turned and whether those levels are still intact.
- Nothing here is financial advice. Position sizing and risk management remain your own responsibility.
This is original work. It reuses no code from any other publication. The source is open, so read it, change it, and take it further.

Fahd Ezzat | Price action and liquidity analysis, and Pine Script indicator development. I share educational market studies with a clear methodology focused on confirmation and risk management. Content is educational and includes no guarantee of results.
免責事項
これらの情報および投稿は、TradingViewが提供または承認する金融、投資、取引、またはその他の種類の助言もしくは推奨であることを意図したものではなく、またこれらに該当するものでもありません。詳細は利用規約をご覧ください。
Fahd Ezzat | Price action and liquidity analysis, and Pine Script indicator development. I share educational market studies with a clear methodology focused on confirmation and risk management. Content is educational and includes no guarantee of results.
免責事項
これらの情報および投稿は、TradingViewが提供または承認する金融、投資、取引、またはその他の種類の助言もしくは推奨であることを意図したものではなく、またこれらに該当するものでもありません。詳細は利用規約をご覧ください。