OPEN-SOURCE SCRIPT
Hydra PVSRA
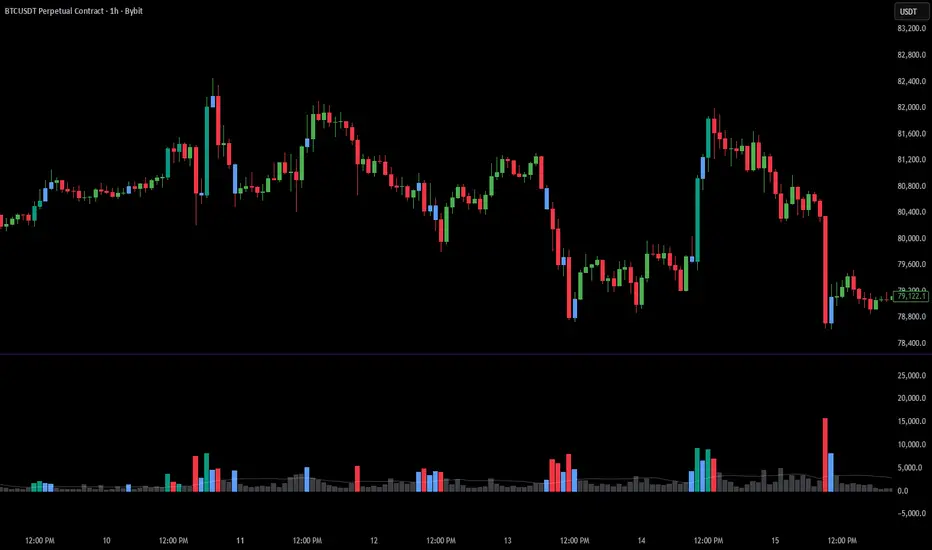
Hydra PVSRA
The Hydra PVSRA is a high-performance analysis tool designed to identify significant market participation by combining volume surges with price expansion logic. By filtering "noise" and focusing on high-interest areas, this indicator helps traders spot potential institutional "footprints" and potential trend reversals.
🚀 Key Features
• Dynamic Volume Spike Detection: Automatically identifies candles where volume exceeds a user-defined percentage of the recent average (default 150%).
• Vector Candle Logic: Goes beyond simple volume by identifying "Vector Candles"—bars that exhibit both high volume and high price spread (volatility). This represents significant "effort" resulting in clear price displacement.
• External Source Override: A powerful feature for cross-exchange analysis. You can override the local volume with a feed from another ticker (e.g., using CME Bitcoin Futures volume while trading on a spot exchange).
• Price Chart Integration: Toggle the "Apply to Price Candles" option to have the detected signals color your main price chart candles automatically.
• Dual Color Themes: Separate, fully customizable color sets for standard local volume and external volume feeds.
• Smart Alerts: Integrated alert() functionality for both general Volume Spikes and specific Bullish/Bearish Vector Candles.
📊 How it Works
1. Volume Spikes
The indicator calculates a Simple Moving Average (SMA) of volume over a lookback period. If the current volume exceeds this average by your specified multiplier, it is flagged as a Spike. This highlights sudden bursts of activity.
2. Vector Candles
A Vector Candle is the ultimate sign of market intent. It occurs when:
• A Volume Spike is present.
• The Price Spread (High - Low) is significantly larger than the recent average spread.
Bullish Vectors suggest aggressive buying/short covering.
Bearish Vectors suggest aggressive selling/long liquidation.
3. External Volume Feed
Professional traders often look at high-liquidity exchanges for the "true" volume. This script allows you to view volume from a master source (like CME or Binance) while keeping your eyes on your preferred trading pair's price action.
⚙️ Settings
Lookback Period: Adjust the window for calculating average volume and spread (Default: 20).
Volume Increase %: The sensitivity for a "spike" (Default: 150%).
Vector Spread Multiplier: How much price expansion is required to upgrade a spike to a "Vector" (Default: 1.5x).
External Symbol: Choose any ticker to use as your volume source.
🔔 Alerts
To set up alerts, create an alert on the indicator and select "Any alert() function call". You will receive notifications for:
• Standard Volume Spikes
• Bullish Vector Candles
• Bearish Vector Candles
The Hydra PVSRA is a high-performance analysis tool designed to identify significant market participation by combining volume surges with price expansion logic. By filtering "noise" and focusing on high-interest areas, this indicator helps traders spot potential institutional "footprints" and potential trend reversals.
🚀 Key Features
• Dynamic Volume Spike Detection: Automatically identifies candles where volume exceeds a user-defined percentage of the recent average (default 150%).
• Vector Candle Logic: Goes beyond simple volume by identifying "Vector Candles"—bars that exhibit both high volume and high price spread (volatility). This represents significant "effort" resulting in clear price displacement.
• External Source Override: A powerful feature for cross-exchange analysis. You can override the local volume with a feed from another ticker (e.g., using CME Bitcoin Futures volume while trading on a spot exchange).
• Price Chart Integration: Toggle the "Apply to Price Candles" option to have the detected signals color your main price chart candles automatically.
• Dual Color Themes: Separate, fully customizable color sets for standard local volume and external volume feeds.
• Smart Alerts: Integrated alert() functionality for both general Volume Spikes and specific Bullish/Bearish Vector Candles.
📊 How it Works
1. Volume Spikes
The indicator calculates a Simple Moving Average (SMA) of volume over a lookback period. If the current volume exceeds this average by your specified multiplier, it is flagged as a Spike. This highlights sudden bursts of activity.
2. Vector Candles
A Vector Candle is the ultimate sign of market intent. It occurs when:
• A Volume Spike is present.
• The Price Spread (High - Low) is significantly larger than the recent average spread.
Bullish Vectors suggest aggressive buying/short covering.
Bearish Vectors suggest aggressive selling/long liquidation.
3. External Volume Feed
Professional traders often look at high-liquidity exchanges for the "true" volume. This script allows you to view volume from a master source (like CME or Binance) while keeping your eyes on your preferred trading pair's price action.
⚙️ Settings
Lookback Period: Adjust the window for calculating average volume and spread (Default: 20).
Volume Increase %: The sensitivity for a "spike" (Default: 150%).
Vector Spread Multiplier: How much price expansion is required to upgrade a spike to a "Vector" (Default: 1.5x).
External Symbol: Choose any ticker to use as your volume source.
🔔 Alerts
To set up alerts, create an alert on the indicator and select "Any alert() function call". You will receive notifications for:
• Standard Volume Spikes
• Bullish Vector Candles
• Bearish Vector Candles
オープンソーススクリプト
TradingViewの精神に則り、このスクリプトの作者はコードをオープンソースとして公開してくれました。トレーダーが内容を確認・検証できるようにという配慮です。作者に拍手を送りましょう!無料で利用できますが、コードの再公開はハウスルールに従う必要があります。

Safe Trading = Profitable Trading
免責事項
これらの情報および投稿は、TradingViewが提供または承認する金融、投資、取引、またはその他の種類の助言もしくは推奨であることを意図したものではなく、またこれらに該当するものでもありません。詳細は利用規約をご覧ください。
オープンソーススクリプト
TradingViewの精神に則り、このスクリプトの作者はコードをオープンソースとして公開してくれました。トレーダーが内容を確認・検証できるようにという配慮です。作者に拍手を送りましょう!無料で利用できますが、コードの再公開はハウスルールに従う必要があります。
Safe Trading = Profitable Trading
免責事項
これらの情報および投稿は、TradingViewが提供または承認する金融、投資、取引、またはその他の種類の助言もしくは推奨であることを意図したものではなく、またこれらに該当するものでもありません。詳細は利用規約をご覧ください。